|
Download Data (XLS File) |
|
||||||||
|
||||||||
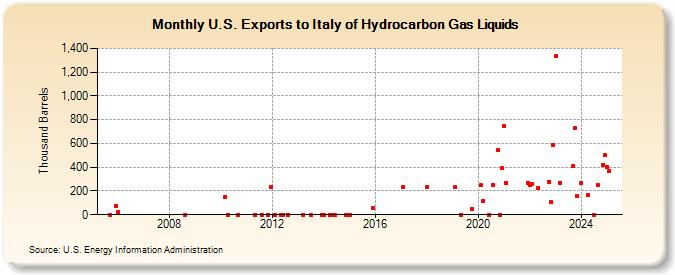
| U.S. Exports to Italy of Hydrocarbon Gas Liquids (Thousand Barrels) | ||||||||
| Year | Jan | Feb | Mar | Apr | May | Jun | Jul | Aug | Sep | Oct | Nov | Dec |
|---|---|---|---|---|---|---|---|---|---|---|---|---|
| 2005 | 0 | 74 | ||||||||||
| 2006 | 22 | |||||||||||
| 2008 | 0 | |||||||||||
| 2010 | 150 | 0 | 1 | |||||||||
| 2011 | 1 | 1 | 0 | 232 | ||||||||
| 2012 | 0 | 0 | 1 | 0 | ||||||||
| 2013 | 0 | 0 | 1 | |||||||||
| 2014 | 0 | 0 | 0 | 0 | 0 | |||||||
| 2015 | 0 | 58 | ||||||||||
| 2017 | 235 | |||||||||||
| 2018 | 236 | |||||||||||
| 2019 | 234 | 0 | 50 | |||||||||
| 2020 | 247 | 117 | 0 | 249 | 548 | 0 | 391 | |||||
| 2021 | 745 | 266 | 267 | |||||||||
| 2022 | 250 | 261 | 226 | 278 | 104 | 591 | ||||||
| 2023 | 1,335 | 409 | 770 | 157 | ||||||||
| 2024 | 266 | |||||||||||
| - = No Data Reported; -- = Not Applicable; NA = Not Available; W = Withheld to avoid disclosure of individual company data. |
| Release Date: 3/29/2024 |
| Next Release Date: 4/30/2024 |