|
Download Data (XLS File) |
|
||||||||
|
||||||||
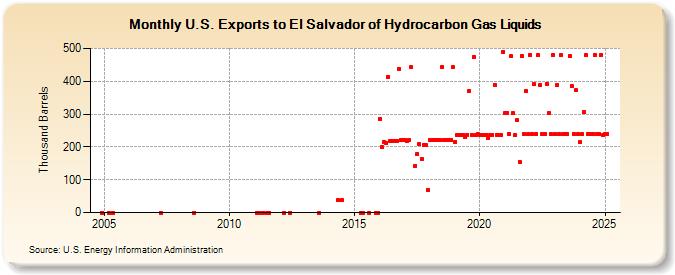
| U.S. Exports to El Salvador of Hydrocarbon Gas Liquids (Thousand Barrels) | ||||||||
| Year | Jan | Feb | Mar | Apr | May | Jun | Jul | Aug | Sep | Oct | Nov | Dec |
|---|---|---|---|---|---|---|---|---|---|---|---|---|
| 2004 | 0 | |||||||||||
| 2005 | 0 | 0 | ||||||||||
| 2007 | 0 | |||||||||||
| 2008 | 0 | |||||||||||
| 2011 | 0 | 0 | 0 | 0 | 0 | |||||||
| 2012 | 0 | 0 | ||||||||||
| 2013 | 0 | |||||||||||
| 2014 | 37 | 37 | ||||||||||
| 2015 | 0 | 0 | 0 | 0 | 0 | |||||||
| 2016 | 286 | 200 | 215 | 213 | 414 | 217 | 219 | 219 | 219 | 438 | 221 | 222 |
| 2017 | 222 | 219 | 222 | 443 | 143 | 178 | 209 | 164 | 206 | 205 | 70 | |
| 2018 | 222 | 222 | 222 | 222 | 222 | 221 | 444 | 222 | 222 | 222 | 222 | 443 |
| 2019 | 216 | 237 | 237 | 237 | 237 | 231 | 237 | 371 | 237 | 474 | 237 | 239 |
| 2020 | 237 | 237 | 237 | 237 | 226 | 237 | 237 | 390 | 237 | 235 | 237 | 490 |
| 2021 | 302 | 304 | 239 | 476 | 302 | 235 | 281 | 154 | 478 | 240 | 370 | 239 |
| 2022 | 481 | 240 | 391 | 240 | 479 | 389 | 240 | 240 | 393 | 303 | 239 | 480 |
| 2023 | 154 | 389 | 239 | 479 | 237 | 154 | 239 | 478 | 385 | 240 | 372 | 240 |
| 2024 | 214 | |||||||||||
| - = No Data Reported; -- = Not Applicable; NA = Not Available; W = Withheld to avoid disclosure of individual company data. |
| Release Date: 3/29/2024 |
| Next Release Date: 4/30/2024 |