|
Download Data (XLS File) |
|
||||||||
|
||||||||
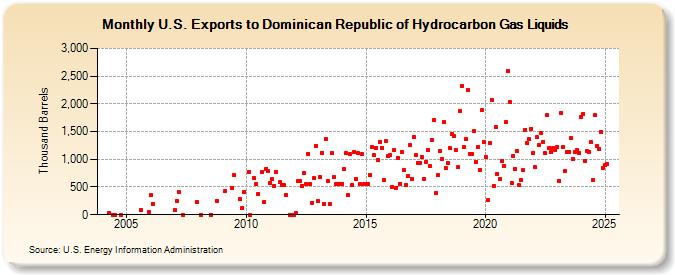
| U.S. Exports to Dominican Republic of Hydrocarbon Gas Liquids (Thousand Barrels) | ||||||||
| Year | Jan | Feb | Mar | Apr | May | Jun | Jul | Aug | Sep | Oct | Nov | Dec |
|---|---|---|---|---|---|---|---|---|---|---|---|---|
| 2004 | 36 | 0 | 0 | 0 | ||||||||
| 2005 | 87 | 41 | ||||||||||
| 2006 | 347 | 191 | ||||||||||
| 2007 | 79 | 250 | 417 | 0 | 231 | |||||||
| 2008 | 0 | 0 | 250 | |||||||||
| 2009 | 422 | 486 | 719 | 278 | 124 | 410 | ||||||
| 2010 | 779 | 0 | 664 | 550 | 381 | 768 | 236 | 832 | 784 | |||
| 2011 | 574 | 636 | 525 | 775 | 582 | 528 | 528 | 356 | 0 | 0 | ||
| 2012 | 0 | 25 | 608 | 606 | 525 | 756 | 550 | 1,100 | 550 | 216 | 658 | 1,235 |
| 2013 | 243 | 673 | 1,121 | 192 | 1,370 | 602 | 194 | 1,110 | 679 | 550 | 550 | 563 |
| 2014 | 563 | 820 | 1,107 | 353 | 1,098 | 534 | 1,124 | 639 | 1,111 | 550 | 1,094 | 545 |
| 2015 | 550 | 550 | 722 | 1,214 | 1,070 | 1,209 | 990 | 1,319 | 1,210 | 625 | 1,324 | 1,059 |
| 2016 | 1,075 | 505 | 1,164 | 484 | 1,031 | 559 | 1,136 | 801 | 534 | 696 | 1,250 | 650 |
| 2017 | 1,408 | 1,072 | 934 | 936 | 1,040 | 652 | 959 | 1,173 | 877 | 1,347 | 1,710 | 394 |
| 2018 | 709 | 1,141 | 1,012 | 1,668 | 845 | 936 | 1,198 | 1,451 | 1,419 | 1,167 | 853 | 1,870 |
| 2019 | 2,326 | 1,223 | 1,361 | 2,253 | 1,102 | 1,094 | 1,501 | 955 | 1,230 | 813 | 1,882 | 1,314 |
| 2020 | 1,038 | 260 | 1,292 | 2,071 | 519 | 1,579 | 742 | 652 | 967 | 873 | 1,673 | 2,595 |
| 2021 | 2,036 | 576 | 1,056 | 828 | 1,143 | 529 | 619 | 807 | 1,537 | 1,286 | 1,358 | 1,553 |
| 2022 | 1,118 | 854 | 1,394 | 1,250 | 1,467 | 1,316 | 1,112 | 1,795 | 1,210 | 1,123 | 1,202 | 1,168 |
| 2023 | 1,229 | 614 | 1,838 | 1,205 | 788 | 1,140 | 1,133 | 1,380 | 1,004 | 1,122 | 1,160 | 1,642 |
| 2024 | 1,759 | |||||||||||
| - = No Data Reported; -- = Not Applicable; NA = Not Available; W = Withheld to avoid disclosure of individual company data. |
| Release Date: 3/29/2024 |
| Next Release Date: 4/30/2024 |