|
Download Data (XLS File) |
|
||||||||
|
||||||||
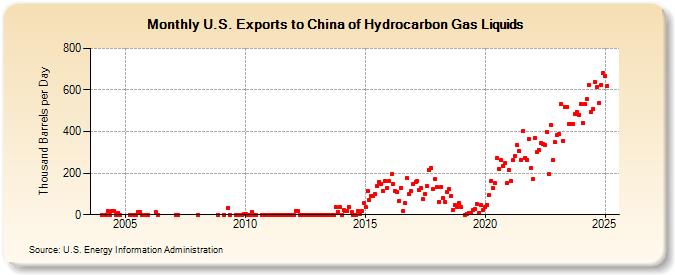
| U.S. Exports to China of Hydrocarbon Gas Liquids (Thousand Barrels per Day) | ||||||||
| Year | Jan | Feb | Mar | Apr | May | Jun | Jul | Aug | Sep | Oct | Nov | Dec |
|---|---|---|---|---|---|---|---|---|---|---|---|---|
| 2004 | 0 | 0 | 16 | 0 | 16 | 16 | 0 | 10 | 0 | |||
| 2005 | 0 | 0 | 1 | 15 | 14 | 0 | 0 | 0 | ||||
| 2006 | 14 | 0 | ||||||||||
| 2007 | 0 | 0 | ||||||||||
| 2008 | 1 | 0 | ||||||||||
| 2009 | 1 | 32 | 1 | 0 | 0 | 0 | 4 | |||||
| 2010 | 2 | 0 | 0 | 15 | 0 | 0 | 0 | 1 | 1 | |||
| 2011 | 0 | 0 | 0 | 0 | 0 | 0 | 0 | 0 | 0 | 0 | 0 | 0 |
| 2012 | 0 | 19 | 18 | 0 | 0 | 0 | 0 | 0 | 0 | 0 | 0 | 0 |
| 2013 | 0 | 0 | 0 | 0 | 0 | 0 | 0 | 0 | 0 | 36 | 13 | 37 |
| 2014 | 0 | 21 | 19 | 19 | 37 | 14 | 0 | 0 | 19 | 2 | 19 | 55 |
| 2015 | 35 | 113 | 70 | 91 | 91 | 99 | 139 | 157 | 150 | 113 | 163 | 130 |
| 2016 | 161 | 194 | 147 | 116 | 109 | 68 | 129 | 19 | 54 | 176 | 99 | 112 |
| 2017 | 146 | 158 | 162 | 117 | 129 | 75 | 100 | 137 | 213 | 225 | 123 | 171 |
| 2018 | 133 | 62 | 135 | 82 | 60 | 109 | 123 | 90 | 25 | 46 | 38 | 55 |
| 2019 | 35 | 0 | 5 | 9 | 9 | 22 | 27 | 50 | 9 | 45 | 23 | |
| 2020 | 37 | 48 | 94 | 163 | 130 | 151 | 273 | 220 | 263 | 232 | 248 | 152 |
| 2021 | 215 | 162 | 262 | 283 | 334 | 306 | 262 | 404 | 274 | 265 | 362 | 224 |
| 2022 | 173 | 370 | 304 | 313 | 344 | 339 | 336 | 399 | 197 | 431 | 263 | 348 |
| 2023 | 388 | 367 | 498 | 361 | 518 | 558 | 427 | 406 | 427 | 484 | 493 | 445 |
| 2024 | 534 | 440 | 534 | 557 | ||||||||
| - = No Data Reported; -- = Not Applicable; NA = Not Available; W = Withheld to avoid disclosure of individual company data. |
| Release Date: 6/28/2024 |
| Next Release Date: 7/31/2024 |