|
Download Data (XLS File) |
|
||||||||
|
||||||||
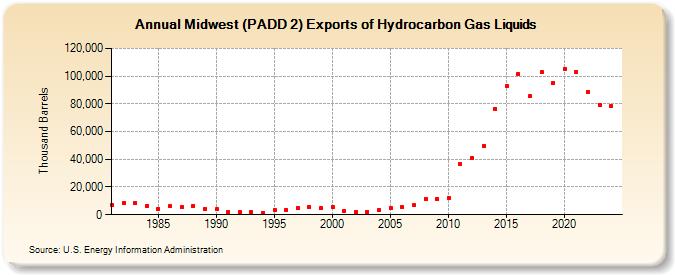
| Midwest (PADD 2) Exports of Hydrocarbon Gas Liquids (Thousand Barrels) | ||||||||
| Decade | Year-0 | Year-1 | Year-2 | Year-3 | Year-4 | Year-5 | Year-6 | Year-7 | Year-8 | Year-9 |
|---|---|---|---|---|---|---|---|---|---|---|
| 1980's | 7,041 | 8,675 | 8,570 | 6,535 | 4,158 | 5,953 | 5,509 | 6,444 | 4,135 | |
| 1990's | 3,933 | 1,717 | 1,727 | 2,064 | 1,514 | 3,493 | 3,545 | 5,088 | 5,851 | 4,535 |
| 2000's | 5,397 | 2,807 | 2,278 | 2,205 | 3,088 | 4,967 | 5,611 | 6,749 | 11,561 | 11,178 |
| 2010's | 12,359 | 36,238 | 40,729 | 49,467 | 76,602 | 92,506 | 101,644 | 85,335 | 102,947 | 95,227 |
| 2020's | 105,390 | 102,818 | 88,457 | 61,557 |
| - = No Data Reported; -- = Not Applicable; NA = Not Available; W = Withheld to avoid disclosure of individual company data. |
| Release Date: 3/29/2024 |
| Next Release Date: 8/30/2024 |