|
Download Data (XLS File) |
|
||||||||
|
||||||||
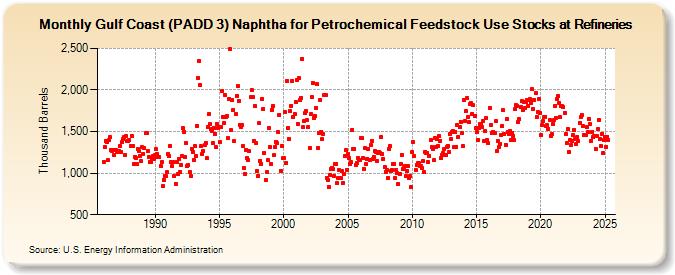
| Gulf Coast (PADD 3) Naphtha for Petrochemical Feedstock Use Stocks at Refineries (Thousand Barrels) | ||||||||
| Year | Jan | Feb | Mar | Apr | May | Jun | Jul | Aug | Sep | Oct | Nov | Dec |
|---|---|---|---|---|---|---|---|---|---|---|---|---|
| 1986 | 1,137 | 1,319 | 1,390 | 1,373 | 1,153 | 1,396 | 1,429 | 1,273 | 1,269 | 1,278 | 1,217 | 1,282 |
| 1987 | 1,251 | 1,262 | 1,267 | 1,332 | 1,249 | 1,369 | 1,407 | 1,432 | 1,222 | 1,442 | 1,390 | 1,381 |
| 1988 | 1,395 | 1,325 | 1,450 | 1,325 | 1,104 | 1,200 | 1,179 | 1,108 | 1,288 | 1,265 | 1,207 | 1,140 |
| 1989 | 1,309 | 1,232 | 1,297 | 1,478 | 1,479 | 1,261 | 1,192 | 1,136 | 1,129 | 1,176 | 1,201 | 1,175 |
| 1990 | 1,221 | 1,287 | 1,230 | 1,193 | 1,190 | 1,086 | 1,132 | 841 | 921 | 968 | 966 | 1,009 |
| 1991 | 1,231 | 1,205 | 1,332 | 1,134 | 1,082 | 1,133 | 965 | 873 | 1,138 | 988 | 1,171 | 1,019 |
| 1992 | 1,092 | 1,209 | 1,539 | 1,499 | 1,194 | 1,364 | 1,080 | 1,101 | 1,013 | 971 | 1,296 | 1,253 |
| 1993 | 1,158 | 1,325 | 1,206 | 1,572 | 2,148 | 2,345 | 2,055 | 1,323 | 1,230 | 1,263 | 1,335 | 1,364 |
| 1994 | 1,178 | 1,552 | 1,711 | 1,589 | 1,536 | 1,502 | 1,359 | 1,546 | 1,476 | 1,313 | 1,585 | 1,546 |
| 1995 | 1,374 | 1,550 | 1,993 | 1,681 | 1,598 | 1,940 | 1,679 | 1,688 | 1,418 | 1,895 | 2,490 | 1,517 |
| 1996 | 1,874 | 1,758 | 1,381 | 1,711 | 1,928 | 2,052 | 1,871 | 1,584 | 1,558 | 1,580 | 1,324 | 1,064 |
| 1997 | 994 | 1,281 | 1,180 | 1,157 | 1,263 | 1,912 | 1,997 | 1,918 | 1,391 | 1,807 | 1,358 | 1,023 |
| 1998 | 966 | 1,598 | 1,151 | 1,111 | 1,894 | 1,777 | 1,244 | 920 | 1,008 | 1,158 | 1,541 | 1,316 |
| 1999 | 1,108 | 1,765 | 1,808 | 1,215 | 1,319 | 1,380 | 1,362 | 1,494 | 1,705 | 1,029 | 1,327 | 1,178 |
| 2000 | 1,187 | 1,738 | 1,122 | 2,108 | 1,544 | 1,411 | 1,748 | 1,812 | 2,111 | 1,674 | 1,710 | 1,856 |
| 2001 | 2,115 | 1,596 | 2,140 | 1,880 | 1,909 | 2,378 | 1,551 | 1,629 | 1,721 | 1,745 | 1,635 | 1,556 |
| 2002 | 1,306 | 1,708 | 1,913 | 2,085 | 1,668 | 1,685 | 1,787 | 2,069 | 1,303 | 1,486 | 1,882 | 1,500 |
| 2003 | 1,408 | 1,474 | 1,938 | 1,935 | 943 | 921 | 836 | 973 | 1,048 | 1,065 | 1,044 | 970 |
| 2004 | 1,112 | 1,112 | 876 | 938 | 1,037 | 936 | 1,028 | 887 | 993 | 1,202 | 1,276 | 1,041 |
| 2005 | 1,231 | 1,182 | 1,107 | 1,129 | 1,524 | 1,285 | 1,293 | 1,095 | 1,121 | 1,182 | 1,162 | 1,163 |
| 2006 | 1,423 | 1,421 | 1,181 | 1,053 | 1,304 | 1,110 | 1,170 | 1,290 | 1,155 | 1,334 | 1,391 | 1,169 |
| 2007 | 1,197 | 1,265 | 1,255 | 1,150 | 1,240 | 1,256 | 1,243 | 1,430 | 1,231 | 1,173 | 1,074 | 1,016 |
| 2008 | 1,039 | 944 | 1,296 | 1,321 | 1,022 | 1,038 | 1,112 | 1,108 | 936 | 1,043 | 996 | 872 |
| 2009 | 993 | 1,112 | 1,224 | 1,048 | 1,063 | 1,087 | 962 | 1,024 | 1,083 | 946 | 964 | 829 |
| 2010 | 1,253 | 1,370 | 1,201 | 1,041 | 1,103 | 1,117 | 1,116 | 1,086 | 1,084 | 1,059 | 1,143 | 1,011 |
| 2011 | 1,259 | 1,248 | 1,245 | 1,131 | 1,211 | 1,395 | 1,313 | 1,293 | 1,152 | 1,428 | 1,312 | 1,407 |
| 2012 | 1,326 | 1,442 | 1,390 | 1,179 | 1,220 | 1,238 | 1,288 | 1,220 | 1,313 | 1,331 | 1,249 | 1,473 |
| 2013 | 1,414 | 1,492 | 1,506 | 1,311 | 1,500 | 1,319 | 1,576 | 1,440 | 1,550 | 1,618 | 1,477 | 1,322 |
| 2014 | 1,882 | 1,623 | 1,744 | 1,909 | 1,680 | 1,612 | 1,830 | 1,838 | 1,715 | 1,816 | 1,687 | 1,538 |
| 2015 | 1,493 | 1,403 | 1,537 | 1,587 | 1,594 | 1,560 | 1,630 | 1,387 | 1,507 | 1,666 | 1,395 | 1,358 |
| 2016 | 1,789 | 1,582 | 1,478 | 1,495 | 1,482 | 1,480 | 1,623 | 1,266 | 1,389 | 1,311 | 1,356 | 1,460 |
| 2017 | 1,570 | 1,754 | 1,476 | 1,342 | 1,654 | 1,495 | 1,468 | 1,505 | 1,394 | 1,481 | 1,451 | 1,397 |
| 2018 | 1,774 | 1,818 | 1,810 | 1,616 | 1,650 | 1,796 | 1,864 | 1,755 | 1,852 | 1,780 | 1,850 | 1,882 |
| 2019 | 1,812 | 1,880 | 1,886 | 1,839 | 2,007 | 1,773 | 1,880 | 1,964 | 1,677 | 1,733 | 1,896 | 1,722 |
| 2020 | 1,460 | 1,582 | 1,622 | 1,673 | 1,681 | 1,570 | 1,573 | 1,528 | 1,636 | 1,450 | 1,475 | 1,592 |
| 2021 | 1,634 | 1,810 | 1,663 | 1,893 | 1,930 | 1,847 | 1,670 | 1,805 | 1,804 | 1,794 | 1,724 | 1,468 |
| 2022 | 1,360 | 1,534 | 1,260 | 1,397 | 1,344 | 1,391 | 1,456 | 1,522 | 1,408 | 1,345 | 1,436 | 1,390 |
| 2023 | 1,606 | 1,679 | 1,699 | 1,566 | 1,467 | 1,464 | 1,458 | 1,551 | 1,493 | 1,654 | 1,621 | 1,391 |
| 2024 | 1,498 | |||||||||||
| - = No Data Reported; -- = Not Applicable; NA = Not Available; W = Withheld to avoid disclosure of individual company data. |
| Release Date: 3/29/2024 |
| Next Release Date: 4/30/2024 |