|
Download Data (XLS File) |
|
||||||||
|
||||||||
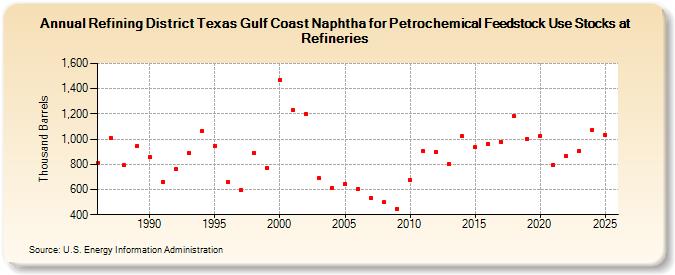
| Refining District Texas Gulf Coast Naphtha for Petrochemical Feedstock Use Stocks at Refineries (Thousand Barrels) | ||||||||
| Decade | Year-0 | Year-1 | Year-2 | Year-3 | Year-4 | Year-5 | Year-6 | Year-7 | Year-8 | Year-9 |
|---|---|---|---|---|---|---|---|---|---|---|
| 1980's | 809 | 1,012 | 793 | 944 | ||||||
| 1990's | 854 | 659 | 762 | 890 | 1,066 | 949 | 659 | 593 | 893 | 769 |
| 2000's | 1,470 | 1,227 | 1,200 | 689 | 613 | 645 | 605 | 532 | 499 | 449 |
| 2010's | 675 | 905 | 901 | 802 | 1,022 | 935 | 965 | 980 | 1,181 | 1,003 |
| 2020's | 1,027 | 795 | 865 | 909 |
| - = No Data Reported; -- = Not Applicable; NA = Not Available; W = Withheld to avoid disclosure of individual company data. |
| Release Date: 3/29/2024 |
| Next Release Date: 8/30/2024 |