|
Download Data (XLS File) |
|
||||||||
|
||||||||
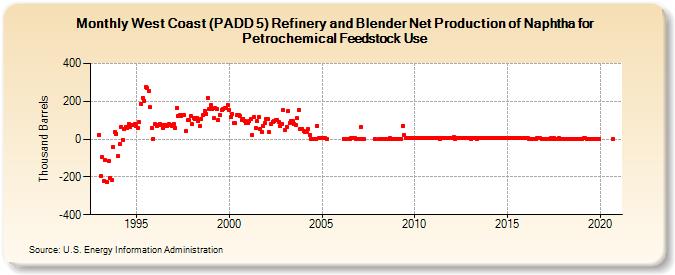
| West Coast (PADD 5) Refinery and Blender Net Production of Naphtha for Petrochemical Feedstock Use (Thousand Barrels) | ||||||||
| Year | Jan | Feb | Mar | Apr | May | Jun | Jul | Aug | Sep | Oct | Nov | Dec |
|---|---|---|---|---|---|---|---|---|---|---|---|---|
| 1993 | 24 | -197 | -95 | -220 | -111 | -227 | -116 | -205 | -214 | -41 | 38 | 29 |
| 1994 | -90 | -27 | 64 | -4 | 51 | 64 | 57 | 80 | 65 | 74 | 76 | 82 |
| 1995 | 69 | 59 | 90 | 185 | 219 | 203 | 274 | 270 | 256 | 168 | 60 | 3 |
| 1996 | 78 | 70 | 72 | 80 | 74 | 57 | 77 | 77 | 68 | 78 | 77 | 67 |
| 1997 | 80 | 61 | 165 | 124 | 125 | 124 | 126 | 125 | 42 | 99 | 99 | 122 |
| 1998 | 79 | 113 | 106 | 111 | 96 | 70 | 108 | 126 | 151 | 133 | 220 | 158 |
| 1999 | 179 | 157 | 109 | 162 | 158 | 102 | 128 | 154 | 161 | 162 | 164 | 180 |
| 2000 | 154 | 115 | 134 | 85 | 83 | 126 | 126 | 120 | 103 | 105 | 95 | 85 |
| 2001 | 84 | 94 | 105 | 22 | 118 | 58 | 94 | 116 | 54 | 38 | 71 | 84 |
| 2002 | 106 | 104 | 35 | 80 | 93 | 94 | 103 | 102 | 91 | 68 | 82 | 155 |
| 2003 | 48 | 66 | 146 | 83 | 98 | 94 | 81 | 73 | 109 | 155 | 53 | 55 |
| 2004 | 42 | 37 | 37 | 53 | 20 | 1 | 2 | 1 | 2 | 69 | 4 | 4 |
| 2005 | 4 | 6 | 4 | 2 | ||||||||
| 2006 | 3 | 2 | 1 | 3 | 3 | 6 | 4 | 5 | 3 | 3 | ||
| 2007 | 3 | 64 | 2 | 3 | 1 | |||||||
| 2008 | 1 | 1 | 1 | 2 | 2 | 2 | 3 | 4 | 3 | 3 | 3 | |
| 2009 | 2 | 3 | 3 | 3 | 68 | 20 | 5 | 7 | 6 | 8 | 7 | 7 |
| 2010 | 6 | 7 | 8 | 7 | 6 | 7 | 6 | 8 | 7 | 8 | 4 | 5 |
| 2011 | 6 | 6 | 6 | 7 | 3 | 8 | 6 | 7 | 7 | 8 | 6 | 6 |
| 2012 | 8 | 11 | 0 | 6 | 5 | 4 | 7 | 6 | 7 | 4 | 4 | 4 |
| 2013 | 3 | 7 | 8 | 5 | 3 | 4 | 4 | 6 | 5 | 5 | 6 | 4 |
| 2014 | 5 | 5 | 5 | 5 | 6 | 7 | 5 | 8 | 7 | 7 | 6 | 6 |
| 2015 | 5 | 6 | 7 | 6 | 4 | 5 | 5 | 8 | 4 | 5 | 4 | 5 |
| 2016 | 7 | 4 | 3 | 3 | 3 | 3 | 3 | 4 | 4 | 4 | 3 | 3 |
| 2017 | 3 | 3 | 3 | 2 | 4 | 3 | 4 | 2 | 1 | 4 | 2 | 3 |
| 2018 | 2 | 2 | 3 | 3 | 3 | 2 | 2 | 3 | 1 | 3 | 2 | 3 |
| 2019 | 3 | 4 | 4 | 1 | 1 | 2 | 1 | 3 | 1 | 2 | 1 | 1 |
| 2020 | 2 | |||||||||||
| - = No Data Reported; -- = Not Applicable; NA = Not Available; W = Withheld to avoid disclosure of individual company data. |
| Release Date: 6/30/2025 |
| Next Release Date: 7/31/2025 |