|
Download Data (XLS File) |
|
||||||||
|
||||||||
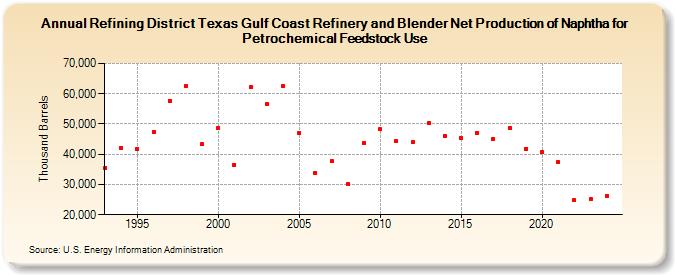
| Refining District Texas Gulf Coast Refinery and Blender Net Production of Naphtha for Petrochemical Feedstock Use (Thousand Barrels) | ||||||||
| Decade | Year-0 | Year-1 | Year-2 | Year-3 | Year-4 | Year-5 | Year-6 | Year-7 | Year-8 | Year-9 |
|---|---|---|---|---|---|---|---|---|---|---|
| 1990's | 35,580 | 42,171 | 41,891 | 47,456 | 57,704 | 62,584 | 43,270 | |||
| 2000's | 48,790 | 36,599 | 62,091 | 56,564 | 62,451 | 46,967 | 33,824 | 37,731 | 30,145 | 43,689 |
| 2010's | 48,201 | 44,215 | 43,942 | 50,378 | 46,098 | 45,524 | 47,148 | 45,180 | 48,680 | 41,843 |
| 2020's | 40,650 | 37,477 | 24,805 | 25,053 |
| - = No Data Reported; -- = Not Applicable; NA = Not Available; W = Withheld to avoid disclosure of individual company data. |
| Release Date: 3/29/2024 |
| Next Release Date: 8/30/2024 |