|
Download Data (XLS File) |
|
||||||||
|
||||||||
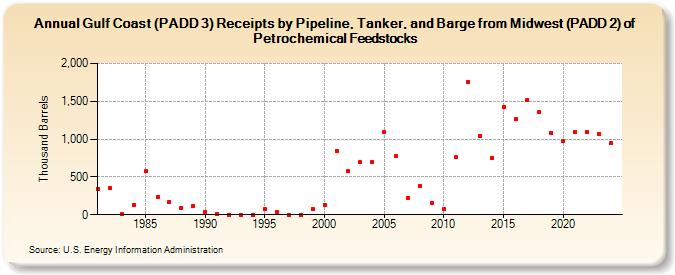
| Gulf Coast (PADD 3) Receipts by Pipeline, Tanker, and Barge from Midwest (PADD 2) of Petrochemical Feedstocks (Thousand Barrels) | ||||||||
| Decade | Year-0 | Year-1 | Year-2 | Year-3 | Year-4 | Year-5 | Year-6 | Year-7 | Year-8 | Year-9 |
|---|---|---|---|---|---|---|---|---|---|---|
| 1980's | 346 | 347 | 9 | 131 | 572 | 239 | 167 | 95 | 121 | |
| 1990's | 38 | 10 | 0 | 0 | 0 | 77 | 40 | 0 | 0 | 81 |
| 2000's | 128 | 847 | 576 | 695 | 691 | 1,092 | 778 | 223 | 378 | 161 |
| 2010's | 76 | 769 | 1,758 | 1,038 | 749 | 1,423 | 1,267 | 1,516 | 1,358 | 1,085 |
| 2020's | 978 | 1,097 | 1,093 | 1,073 | 943 |
| - = No Data Reported; -- = Not Applicable; NA = Not Available; W = Withheld to avoid disclosure of individual company data. |
| Release Date: 6/30/2025 |
| Next Release Date: 8/29/2025 |