|
Download Data (XLS File) |
|
||||||||
|
||||||||
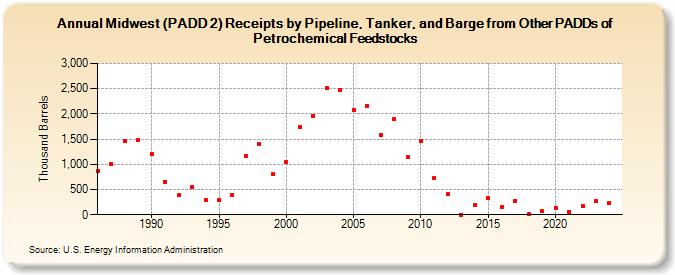
| Midwest (PADD 2) Receipts by Pipeline, Tanker, and Barge from Other PADDs of Petrochemical Feedstocks (Thousand Barrels) | ||||||||
| Decade | Year-0 | Year-1 | Year-2 | Year-3 | Year-4 | Year-5 | Year-6 | Year-7 | Year-8 | Year-9 |
|---|---|---|---|---|---|---|---|---|---|---|
| 1980's | 860 | 1,011 | 1,455 | 1,473 | ||||||
| 1990's | 1,212 | 644 | 388 | 558 | 288 | 286 | 390 | 1,160 | 1,399 | 799 |
| 2000's | 1,051 | 1,734 | 1,966 | 2,512 | 2,475 | 2,083 | 2,166 | 1,574 | 1,893 | 1,146 |
| 2010's | 1,472 | 723 | 401 | 0 | 187 | 331 | 151 | 280 | 9 | 67 |
| 2020's | 139 | 46 | 171 | 276 |
| - = No Data Reported; -- = Not Applicable; NA = Not Available; W = Withheld to avoid disclosure of individual company data. |
| Release Date: 3/29/2024 |
| Next Release Date: 8/30/2024 |