|
Download Data (XLS File) |
|
||||||||
|
||||||||
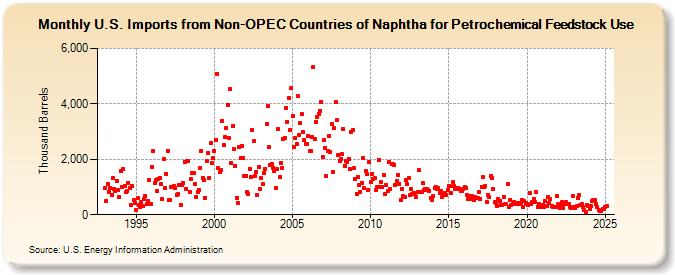
| U.S. Imports from Non-OPEC Countries of Naphtha for Petrochemical Feedstock Use (Thousand Barrels) | ||||||||
| Year | Jan | Feb | Mar | Apr | May | Jun | Jul | Aug | Sep | Oct | Nov | Dec |
|---|---|---|---|---|---|---|---|---|---|---|---|---|
| 1993 | 958 | 504 | 1,119 | 830 | 956 | 724 | 1,309 | 921 | 851 | 1,210 | 877 | 646 |
| 1994 | 1,562 | 1,012 | 1,645 | 1,032 | 808 | 842 | 1,149 | 977 | 362 | 1,029 | 537 | 410 |
| 1995 | 159 | 597 | 333 | 280 | 471 | 316 | 564 | 682 | 374 | 507 | 1,253 | 376 |
| 1996 | 1,713 | 2,293 | 1,128 | 1,270 | 840 | 1,295 | 1,318 | 1,094 | 559 | 2,023 | 981 | 1,483 |
| 1997 | 2,306 | 542 | 530 | 1,004 | 999 | 1,030 | 972 | 727 | 744 | 1,080 | 349 | 1,061 |
| 1998 | 1,130 | 1,913 | 921 | 1,922 | 1,933 | 827 | 1,275 | 1,520 | 1,505 | 1,119 | 656 | 824 |
| 1999 | 882 | 1,690 | 2,311 | 1,331 | 1,245 | 620 | 1,935 | 2,244 | 1,335 | 2,579 | 1,861 | 2,046 |
| 2000 | 2,302 | 2,696 | 5,079 | 1,679 | 1,537 | 1,607 | 3,392 | 2,509 | 2,795 | 3,140 | 3,969 | 2,775 |
| 2001 | 4,520 | 1,881 | 3,209 | 2,358 | 1,766 | 604 | 427 | 2,429 | 2,045 | 2,488 | 2,030 | 1,409 |
| 2002 | 1,411 | 811 | 733 | 1,661 | 1,352 | 3,057 | 2,647 | 1,391 | 1,552 | 698 | 1,734 | 919 |
| 2003 | 1,314 | 1,094 | 1,507 | 1,662 | 3,274 | 3,925 | 2,451 | 1,787 | 1,836 | 1,698 | 1,588 | 980 |
| 2004 | 1,634 | 3,100 | 1,357 | 1,880 | 1,700 | 2,722 | 2,760 | 3,865 | 3,359 | 4,212 | 3,069 | 4,572 |
| 2005 | 3,569 | 2,451 | 2,751 | 2,536 | 4,281 | 2,868 | 3,301 | 3,637 | 2,982 | 2,702 | 2,569 | 2,569 |
| 2006 | 2,827 | 2,285 | 2,315 | 2,811 | 5,335 | 2,749 | 3,337 | 3,524 | 3,650 | 3,748 | 4,080 | 2,087 |
| 2007 | 2,687 | 2,419 | 1,384 | 2,314 | 2,857 | 2,273 | 3,257 | 1,555 | 3,116 | 4,057 | 3,400 | 2,169 |
| 2008 | 1,931 | 2,002 | 2,175 | 3,077 | 1,770 | 1,943 | 1,919 | 2,024 | 1,664 | 2,992 | 3,047 | 1,676 |
| 2009 | 1,289 | 748 | 1,378 | 1,058 | 830 | 1,160 | 2,036 | 951 | 1,576 | 1,451 | 903 | 1,890 |
| 2010 | 1,166 | 1,485 | 1,276 | 1,329 | 879 | 991 | 1,973 | 1,012 | 1,172 | 986 | 1,435 | 735 |
| 2011 | 1,083 | 861 | 1,892 | 932 | 1,826 | 1,819 | 1,798 | 1,089 | 1,220 | 1,444 | 1,123 | 523 |
| 2012 | 937 | 662 | 655 | 1,249 | 1,100 | 1,311 | 700 | 933 | 754 | 794 | 747 | 647 |
| 2013 | 805 | 1,622 | 816 | 806 | 1,128 | 878 | 934 | 917 | 882 | 856 | 617 | 522 |
| 2014 | 666 | 956 | 985 | 928 | 951 | 793 | 846 | 645 | 697 | 790 | 695 | 895 |
| 2015 | 1,036 | 1,022 | 781 | 1,179 | 1,034 | 941 | 949 | 979 | 934 | 869 | 840 | 937 |
| 2016 | 1,014 | 961 | 711 | 573 | 675 | 559 | 664 | 529 | 637 | 602 | 618 | 809 |
| 2017 | 552 | 1,016 | 1,351 | 996 | 1,041 | 470 | 729 | 635 | 1,400 | 1,339 | 929 | 451 |
| 2018 | 422 | 323 | 567 | 502 | 342 | 367 | 651 | 376 | 401 | 1,106 | 287 | 543 |
| 2019 | 351 | 393 | 476 | 426 | 370 | 440 | 404 | 436 | 544 | 280 | 489 | 411 |
| 2020 | 388 | 337 | 775 | 385 | 472 | 582 | 445 | 814 | 292 | 372 | 301 | 295 |
| 2021 | 341 | 263 | 492 | 308 | 654 | 418 | 569 | 319 | 293 | 261 | 289 | 661 |
| 2022 | 378 | 246 | 355 | 441 | 250 | 391 | 461 | 390 | 378 | 283 | 228 | 691 |
| 2023 | 291 | 239 | 321 | 591 | 697 | 361 | 375 | 272 | 153 | 115 | 350 | 307 |
| 2024 | 200 | |||||||||||
| - = No Data Reported; -- = Not Applicable; NA = Not Available; W = Withheld to avoid disclosure of individual company data. |
| Release Date: 3/29/2024 |
| Next Release Date: 4/30/2024 |