|
Download Data (XLS File) |
|
||||||||
|
||||||||
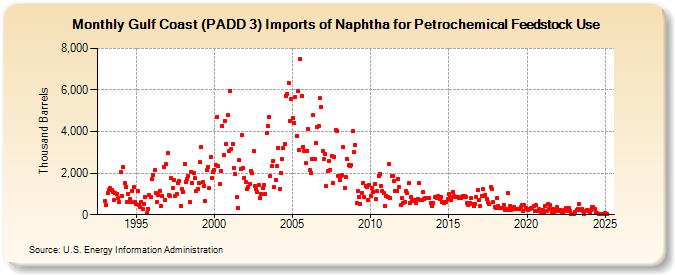
| Gulf Coast (PADD 3) Imports of Naphtha for Petrochemical Feedstock Use (Thousand Barrels) | ||||||||
| Year | Jan | Feb | Mar | Apr | May | Jun | Jul | Aug | Sep | Oct | Nov | Dec |
|---|---|---|---|---|---|---|---|---|---|---|---|---|
| 1993 | 645 | 452 | 1,021 | 1,184 | 1,272 | 1,166 | 1,114 | 698 | 1,028 | 984 | 817 | 629 |
| 1994 | 2,047 | 893 | 2,305 | 1,529 | 1,340 | 589 | 1,016 | 764 | 605 | 1,154 | 1,309 | 619 |
| 1995 | 502 | 1,122 | 448 | 387 | 617 | 279 | 494 | 865 | 73 | 292 | 926 | 838 |
| 1996 | 1,727 | 1,898 | 2,136 | 1,062 | 628 | 945 | 1,151 | 413 | 880 | 2,295 | 697 | 2,425 |
| 1997 | 2,949 | 925 | 889 | 1,775 | 1,264 | 1,666 | 913 | 1,016 | 1,512 | 1,610 | 437 | 1,243 |
| 1998 | 1,081 | 2,435 | 1,597 | 1,731 | 1,844 | 607 | 2,068 | 1,523 | 2,010 | 1,762 | 1,152 | 1,257 |
| 1999 | 1,522 | 2,518 | 3,255 | 1,559 | 1,369 | 640 | 2,146 | 2,288 | 1,278 | 2,753 | 1,768 | 2,072 |
| 2000 | 2,174 | 2,397 | 4,695 | 2,322 | 1,459 | 2,111 | 4,278 | 2,871 | 4,521 | 3,423 | 4,783 | 3,051 |
| 2001 | 5,957 | 3,169 | 3,422 | 2,240 | 1,956 | 837 | 347 | 2,613 | 2,193 | 3,858 | 2,249 | 1,789 |
| 2002 | 1,552 | 1,237 | 1,325 | 1,494 | 2,096 | 1,997 | 3,081 | 1,364 | 1,255 | 1,078 | 1,421 | 792 |
| 2003 | 1,013 | 1,264 | 1,435 | 990 | 3,951 | 4,284 | 4,690 | 1,869 | 2,354 | 2,574 | 1,316 | 1,673 |
| 2004 | 2,334 | 3,223 | 1,223 | 2,005 | 2,675 | 3,190 | 3,388 | 5,698 | 5,812 | 6,353 | 4,516 | 5,579 |
| 2005 | 4,645 | 4,412 | 5,654 | 3,767 | 5,934 | 3,100 | 7,507 | 5,718 | 3,270 | 3,070 | 2,466 | 3,077 |
| 2006 | 4,133 | 2,133 | 2,018 | 2,692 | 4,776 | 2,681 | 3,441 | 4,216 | 4,252 | 5,597 | 5,203 | 3,085 |
| 2007 | 2,679 | 2,941 | 1,362 | 2,111 | 2,582 | 2,172 | 2,828 | 1,504 | 2,787 | 4,057 | 4,031 | 1,874 |
| 2008 | 1,680 | 1,869 | 1,906 | 3,244 | 1,278 | 1,799 | 2,665 | 2,389 | 2,356 | 2,388 | 4,003 | 3,015 |
| 2009 | 3,370 | 580 | 1,151 | 846 | 533 | 1,062 | 1,522 | 844 | 1,404 | 1,320 | 713 | 1,435 |
| 2010 | 880 | 1,297 | 1,104 | 1,455 | 746 | 1,118 | 1,863 | 1,981 | 1,383 | 1,151 | 1,049 | 423 |
| 2011 | 912 | 876 | 2,420 | 783 | 1,849 | 1,882 | 1,637 | 1,145 | 1,152 | 1,720 | 1,318 | 455 |
| 2012 | 816 | 560 | 604 | 1,141 | 1,030 | 1,508 | 550 | 849 | 675 | 708 | 701 | 545 |
| 2013 | 753 | 1,530 | 728 | 709 | 1,074 | 763 | 805 | 812 | 791 | 809 | 579 | 400 |
| 2014 | 553 | 859 | 832 | 811 | 878 | 742 | 849 | 590 | 586 | 625 | 634 | 774 |
| 2015 | 991 | 832 | 691 | 1,090 | 879 | 835 | 828 | 861 | 816 | 796 | 853 | 907 |
| 2016 | 892 | 843 | 579 | 464 | 560 | 782 | 537 | 396 | 507 | 836 | 1,187 | 707 |
| 2017 | 433 | 901 | 1,229 | 889 | 938 | 733 | 602 | 517 | 1,314 | 1,219 | 625 | 365 |
| 2018 | 310 | 791 | 421 | 343 | 340 | 306 | 478 | 250 | 291 | 1,044 | 213 | 422 |
| 2019 | 230 | 273 | 371 | 295 | 293 | 283 | 291 | 348 | 458 | 164 | 453 | 300 |
| 2020 | 272 | 245 | 297 | 308 | 345 | 430 | 177 | 454 | 179 | 288 | 186 | 134 |
| 2021 | 241 | 148 | 421 | 184 | 528 | 286 | 444 | 139 | 252 | 143 | 168 | 365 |
| 2022 | 215 | 163 | 211 | 73 | 142 | 246 | 303 | 178 | 308 | 161 | 36 | 24 |
| 2023 | 55 | 121 | 233 | 283 | 497 | 240 | 259 | 179 | 35 | 204 | 156 | |
| 2024 | 75 | 229 | 361 | 380 | ||||||||
| - = No Data Reported; -- = Not Applicable; NA = Not Available; W = Withheld to avoid disclosure of individual company data. |
| Release Date: 6/28/2024 |
| Next Release Date: 7/31/2024 |