|
Download Data (XLS File) |
|
||||||||
|
||||||||
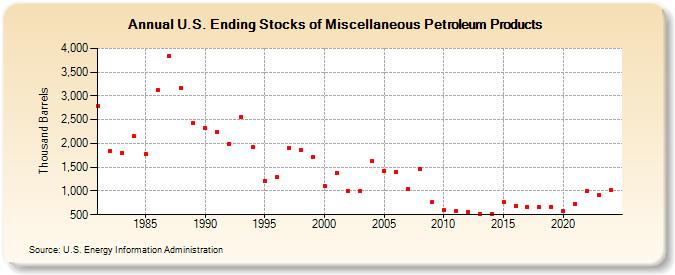
| U.S. Ending Stocks of Miscellaneous Petroleum Products (Thousand Barrels) | ||||||||
| Decade | Year-0 | Year-1 | Year-2 | Year-3 | Year-4 | Year-5 | Year-6 | Year-7 | Year-8 | Year-9 |
|---|---|---|---|---|---|---|---|---|---|---|
| 1980's | 2,780 | 1,832 | 1,809 | 2,148 | 1,781 | 3,127 | 3,841 | 3,159 | 2,420 | |
| 1990's | 2,319 | 2,235 | 1,996 | 2,553 | 1,927 | 1,216 | 1,289 | 1,907 | 1,853 | 1,708 |
| 2000's | 1,107 | 1,379 | 990 | 993 | 1,633 | 1,430 | 1,408 | 1,049 | 1,457 | 768 |
| 2010's | 602 | 572 | 555 | 517 | 525 | 776 | 682 | 671 | 660 | 669 |
| 2020's | 568 | 732 | 1,002 | 916 |
| - = No Data Reported; -- = Not Applicable; NA = Not Available; W = Withheld to avoid disclosure of individual company data. |
| Release Date: 8/30/2024 |
| Next Release Date: 8/29/2025 |