|
Download Data (XLS File) |
|
||||||||
|
||||||||
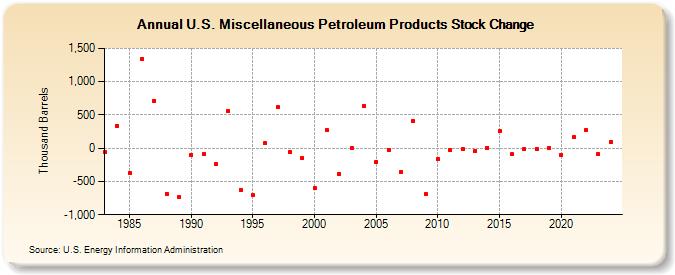
| U.S. Miscellaneous Petroleum Products Stock Change (Thousand Barrels) | ||||||||
| Decade | Year-0 | Year-1 | Year-2 | Year-3 | Year-4 | Year-5 | Year-6 | Year-7 | Year-8 | Year-9 |
|---|---|---|---|---|---|---|---|---|---|---|
| 1980's | -54 | 339 | -367 | 1,346 | 714 | -682 | -739 | |||
| 1990's | -101 | -84 | -239 | 557 | -626 | -711 | 73 | 618 | -54 | -145 |
| 2000's | -601 | 272 | -389 | 3 | 640 | -203 | -22 | -359 | 408 | -689 |
| 2010's | -166 | -30 | -17 | -38 | 8 | 251 | -94 | -11 | -11 | 9 |
| 2020's | -101 | 164 | 270 | 24 |
| - = No Data Reported; -- = Not Applicable; NA = Not Available; W = Withheld to avoid disclosure of individual company data. |
| Release Date: 3/29/2024 |
| Next Release Date: 8/30/2024 |
Referring Pages: