|
Download Data (XLS File) |
|
||||||||
|
||||||||
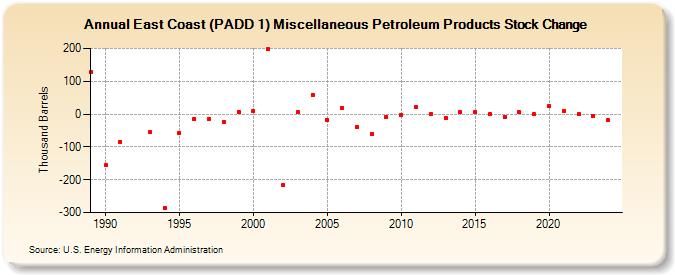
| East Coast (PADD 1) Miscellaneous Petroleum Products Stock Change (Thousand Barrels) | ||||||||
| Decade | Year-0 | Year-1 | Year-2 | Year-3 | Year-4 | Year-5 | Year-6 | Year-7 | Year-8 | Year-9 |
|---|---|---|---|---|---|---|---|---|---|---|
| 1980's | 127 | |||||||||
| 1990's | -156 | -85 | -56 | -285 | -57 | -14 | -15 | -23 | 7 | |
| 2000's | 9 | 197 | -217 | 6 | 59 | -18 | 19 | -38 | -61 | -9 |
| 2010's | -2 | 20 | 0 | -12 | 5 | 6 | 0 | -8 | 5 | -1 |
| 2020's | 24 | 10 | -1 | -6 |
| - = No Data Reported; -- = Not Applicable; NA = Not Available; W = Withheld to avoid disclosure of individual company data. |
| Release Date: 3/29/2024 |
| Next Release Date: 8/30/2024 |