|
Download Data (XLS File) |
|
||||||||
|
||||||||
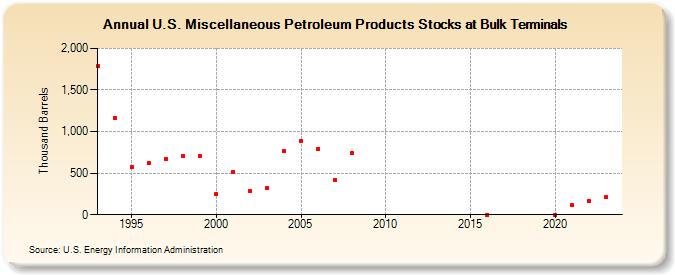
| U.S. Miscellaneous Petroleum Products Stocks at Bulk Terminals (Thousand Barrels) | ||||||||
| Decade | Year-0 | Year-1 | Year-2 | Year-3 | Year-4 | Year-5 | Year-6 | Year-7 | Year-8 | Year-9 |
|---|---|---|---|---|---|---|---|---|---|---|
| 1990's | 1,787 | 1,161 | 573 | 620 | 674 | 703 | 705 | |||
| 2000's | 250 | 519 | 288 | 324 | 769 | 892 | 792 | 416 | 743 | |
| 2010's | 1 | |||||||||
| 2020's | 2 | 113 | 159 | 207 |
| - = No Data Reported; -- = Not Applicable; NA = Not Available; W = Withheld to avoid disclosure of individual company data. |
| Release Date: 3/29/2024 |
| Next Release Date: 8/30/2024 |