|
Download Data (XLS File) |
|
||||||||
|
||||||||
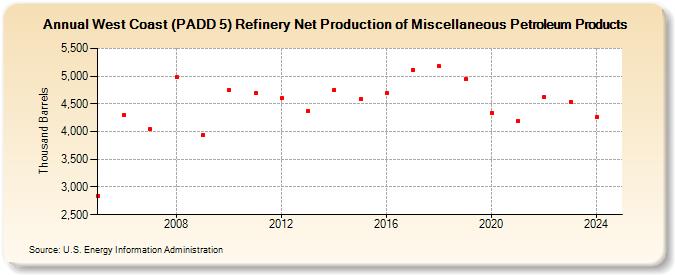
| West Coast (PADD 5) Refinery Net Production of Miscellaneous Petroleum Products (Thousand Barrels) | ||||||||
| Decade | Year-0 | Year-1 | Year-2 | Year-3 | Year-4 | Year-5 | Year-6 | Year-7 | Year-8 | Year-9 |
|---|---|---|---|---|---|---|---|---|---|---|
| 2000's | 2,845 | 4,305 | 4,039 | 4,976 | 3,941 | |||||
| 2010's | 4,752 | 4,695 | 4,600 | 4,375 | 4,757 | 4,584 | 4,693 | 5,118 | 5,175 | 4,946 |
| 2020's | 4,341 | 4,193 | 4,627 | 4,539 |
| - = No Data Reported; -- = Not Applicable; NA = Not Available; W = Withheld to avoid disclosure of individual company data. |
| Release Date: 3/29/2024 |
| Next Release Date: 8/30/2024 |