|
Download Data (XLS File) |
|
||||||||
|
||||||||
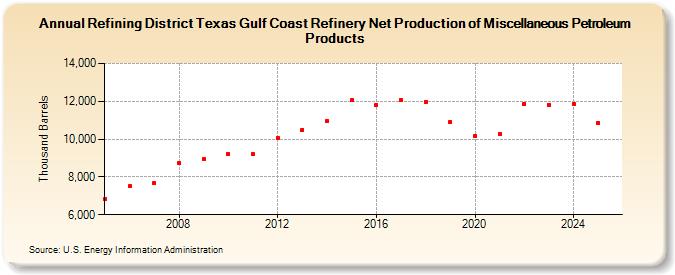
| Refining District Texas Gulf Coast Refinery Net Production of Miscellaneous Petroleum Products (Thousand Barrels) | ||||||||
| Decade | Year-0 | Year-1 | Year-2 | Year-3 | Year-4 | Year-5 | Year-6 | Year-7 | Year-8 | Year-9 |
|---|---|---|---|---|---|---|---|---|---|---|
| 2000's | 6,820 | 7,499 | 7,664 | 8,737 | 8,922 | |||||
| 2010's | 9,220 | 9,190 | 10,045 | 10,498 | 10,965 | 12,062 | 11,811 | 12,085 | 11,985 | 10,905 |
| 2020's | 10,177 | 10,286 | 11,867 | 11,830 |
| - = No Data Reported; -- = Not Applicable; NA = Not Available; W = Withheld to avoid disclosure of individual company data. |
| Release Date: 3/29/2024 |
| Next Release Date: 8/30/2024 |