|
Download Data (XLS File) |
|
||||||||
|
||||||||
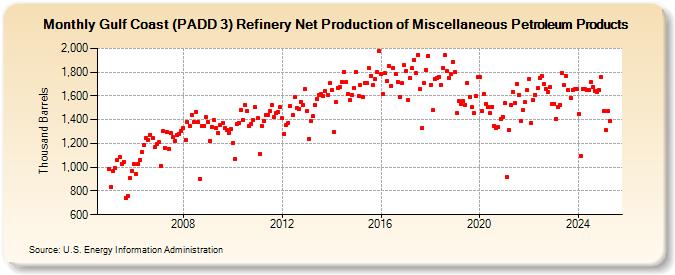
| Gulf Coast (PADD 3) Refinery Net Production of Miscellaneous Petroleum Products (Thousand Barrels) | ||||||||
| Year | Jan | Feb | Mar | Apr | May | Jun | Jul | Aug | Sep | Oct | Nov | Dec |
|---|---|---|---|---|---|---|---|---|---|---|---|---|
| 2005 | 984 | 834 | 966 | 994 | 1,060 | 1,089 | 1,030 | 1,047 | 743 | 756 | 906 | 967 |
| 2006 | 1,026 | 944 | 1,025 | 1,064 | 1,127 | 1,187 | 1,245 | 1,229 | 1,275 | 1,244 | 1,167 | 1,195 |
| 2007 | 1,208 | 1,014 | 1,301 | 1,162 | 1,293 | 1,156 | 1,284 | 1,253 | 1,222 | 1,268 | 1,283 | 1,306 |
| 2008 | 1,331 | 1,233 | 1,384 | 1,350 | 1,440 | 1,378 | 1,466 | 1,382 | 904 | 1,348 | 1,350 | 1,420 |
| 2009 | 1,384 | 1,220 | 1,341 | 1,396 | 1,328 | 1,290 | 1,357 | 1,372 | 1,330 | 1,317 | 1,289 | 1,318 |
| 2010 | 1,206 | 1,069 | 1,360 | 1,376 | 1,480 | 1,400 | 1,525 | 1,473 | 1,343 | 1,365 | 1,396 | 1,503 |
| 2011 | 1,411 | 1,113 | 1,349 | 1,392 | 1,438 | 1,443 | 1,470 | 1,521 | 1,422 | 1,454 | 1,463 | 1,504 |
| 2012 | 1,411 | 1,281 | 1,359 | 1,373 | 1,516 | 1,437 | 1,587 | 1,499 | 1,489 | 1,549 | 1,527 | 1,657 |
| 2013 | 1,475 | 1,241 | 1,387 | 1,427 | 1,523 | 1,577 | 1,611 | 1,614 | 1,596 | 1,638 | 1,610 | 1,706 |
| 2014 | 1,648 | 1,300 | 1,547 | 1,667 | 1,679 | 1,720 | 1,805 | 1,713 | 1,620 | 1,564 | 1,606 | 1,669 |
| 2015 | 1,800 | 1,601 | 1,691 | 1,592 | 1,711 | 1,706 | 1,833 | 1,770 | 1,691 | 1,742 | 1,804 | 1,979 |
| 2016 | 1,786 | 1,612 | 1,791 | 1,724 | 1,854 | 1,686 | 1,833 | 1,781 | 1,717 | 1,587 | 1,705 | 1,856 |
| 2017 | 1,806 | 1,564 | 1,753 | 1,831 | 1,904 | 1,792 | 1,948 | 1,660 | 1,333 | 1,708 | 1,818 | 1,939 |
| 2018 | 1,695 | 1,478 | 1,743 | 1,751 | 1,762 | 1,696 | 1,832 | 1,941 | 1,809 | 1,754 | 1,783 | 1,884 |
| 2019 | 1,802 | 1,454 | 1,557 | 1,536 | 1,557 | 1,525 | 1,711 | 1,594 | 1,503 | 1,453 | 1,601 | 1,758 |
| 2020 | 1,761 | 1,475 | 1,613 | 1,536 | 1,509 | 1,454 | 1,509 | 1,350 | 1,333 | 1,337 | 1,402 | 1,425 |
| 2021 | 1,537 | 919 | 1,316 | 1,523 | 1,637 | 1,539 | 1,700 | 1,609 | 1,389 | 1,478 | 1,546 | 1,648 |
| 2022 | 1,744 | 1,376 | 1,564 | 1,611 | 1,663 | 1,749 | 1,767 | 1,698 | 1,658 | 1,634 | 1,672 | 1,528 |
| 2023 | 1,573 | 1,455 | 1,504 | 1,526 | 1,797 | 1,689 | 1,767 | 1,648 | 1,584 | 1,653 | 1,656 | 1,657 |
| 2024 | 1,448 | 1,098 | 1,659 | 1,658 | ||||||||
| - = No Data Reported; -- = Not Applicable; NA = Not Available; W = Withheld to avoid disclosure of individual company data. |
| Release Date: 6/28/2024 |
| Next Release Date: 7/31/2024 |