|
Download Data (XLS File) |
|
||||||||
|
||||||||
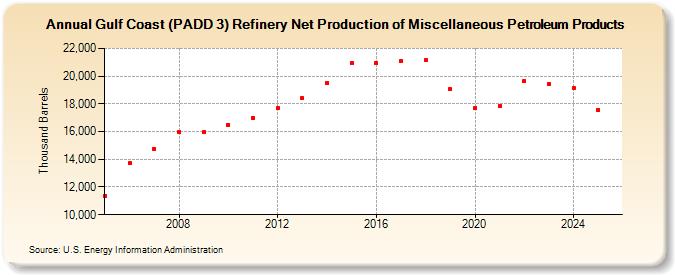
| Gulf Coast (PADD 3) Refinery Net Production of Miscellaneous Petroleum Products (Thousand Barrels) | ||||||||
| Decade | Year-0 | Year-1 | Year-2 | Year-3 | Year-4 | Year-5 | Year-6 | Year-7 | Year-8 | Year-9 |
|---|---|---|---|---|---|---|---|---|---|---|
| 2000's | 11,376 | 13,728 | 14,750 | 15,986 | 15,942 | |||||
| 2010's | 16,496 | 16,980 | 17,685 | 18,405 | 19,538 | 20,920 | 20,932 | 21,056 | 21,128 | 19,051 |
| 2020's | 17,704 | 17,841 | 19,664 | 19,509 |
| - = No Data Reported; -- = Not Applicable; NA = Not Available; W = Withheld to avoid disclosure of individual company data. |
| Release Date: 3/29/2024 |
| Next Release Date: 8/30/2024 |