|
Download Data (XLS File) |
|
||||||||
|
||||||||
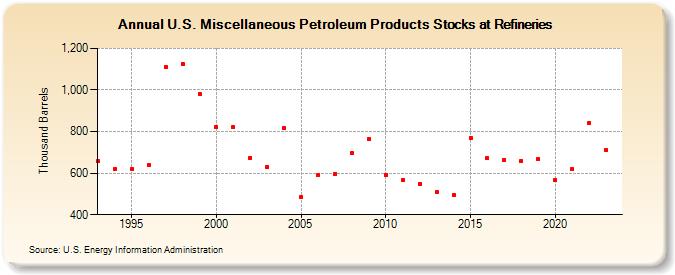
| U.S. Miscellaneous Petroleum Products Stocks at Refineries (Thousand Barrels) | ||||||||
| Decade | Year-0 | Year-1 | Year-2 | Year-3 | Year-4 | Year-5 | Year-6 | Year-7 | Year-8 | Year-9 |
|---|---|---|---|---|---|---|---|---|---|---|
| 1990's | 657 | 619 | 620 | 639 | 1,112 | 1,126 | 982 | |||
| 2000's | 822 | 821 | 674 | 629 | 816 | 483 | 589 | 598 | 696 | 763 |
| 2010's | 591 | 567 | 550 | 509 | 495 | 771 | 672 | 662 | 660 | 669 |
| 2020's | 566 | 619 | 843 | 712 |
| - = No Data Reported; -- = Not Applicable; NA = Not Available; W = Withheld to avoid disclosure of individual company data. |
| Release Date: 3/29/2024 |
| Next Release Date: 8/30/2024 |