|
Download Data (XLS File) |
|
||||||||
|
||||||||
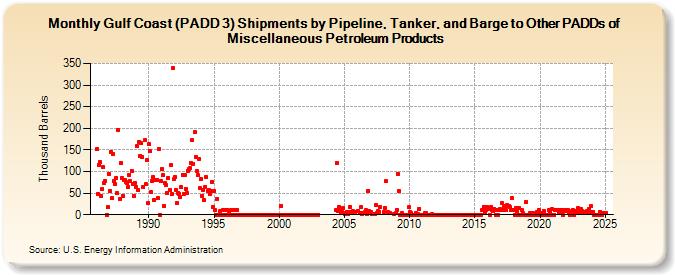
| Gulf Coast (PADD 3) Shipments by Pipeline, Tanker, and Barge to Other PADDs of Miscellaneous Petroleum Products (Thousand Barrels) | ||||||||
| Year | Jan | Feb | Mar | Apr | May | Jun | Jul | Aug | Sep | Oct | Nov | Dec |
|---|---|---|---|---|---|---|---|---|---|---|---|---|
| 1986 | 151 | 49 | 116 | 121 | 44 | 60 | 110 | 74 | 78 | 0 | 17 | 95 |
| 1987 | 56 | 146 | 38 | 140 | 78 | 71 | 85 | 50 | 197 | 36 | 119 | 86 |
| 1988 | 44 | 81 | 81 | 76 | 73 | 65 | 93 | 78 | 102 | 72 | 44 | 74 |
| 1989 | 65 | 158 | 58 | 169 | 137 | 165 | 134 | 64 | 172 | 70 | 126 | 27 |
| 1990 | 163 | 147 | 52 | 79 | 87 | 33 | 81 | 81 | 38 | 152 | 0 | 77 |
| 1991 | 106 | 91 | 21 | 74 | 69 | 50 | 85 | 57 | 115 | 47 | 339 | 82 |
| 1992 | 87 | 58 | 27 | 51 | 49 | 41 | 63 | 93 | 48 | 91 | 60 | 51 |
| 1993 | 102 | 105 | 107 | 120 | 172 | 118 | 192 | 134 | 102 | 91 | 130 | 61 |
| 1994 | 83 | 44 | 58 | 34 | 65 | 87 | 54 | 58 | 49 | 56 | 76 | 19 |
| 1995 | 56 | 10 | 0 | 36 | 0 | 8 | 0 | 0 | 11 | 10 | 0 | 0 |
| 1996 | 12 | 0 | 8 | 0 | 11 | 0 | 11 | 0 | 11 | 11 | 0 | 0 |
| 1997 | 0 | 0 | 0 | 0 | 0 | 0 | 0 | 0 | 0 | 0 | 0 | 0 |
| 1998 | 0 | 0 | 0 | 0 | 0 | 0 | 0 | 0 | 0 | 0 | 0 | 0 |
| 1999 | 0 | 0 | 0 | 0 | 0 | 0 | 0 | 0 | 0 | 0 | 0 | 0 |
| 2000 | 0 | 0 | 20 | 0 | 0 | 0 | 0 | 0 | 0 | 0 | 0 | 0 |
| 2001 | 0 | 0 | 0 | 0 | 0 | 0 | 0 | 0 | 0 | 0 | 0 | 0 |
| 2002 | 0 | 0 | 0 | 0 | 0 | 0 | 0 | 0 | 0 | 0 | 0 | 0 |
| 2003 | 0 | |||||||||||
| 2004 | 10 | 120 | 8 | 19 | 9 | 3 | 6 | 15 | ||||
| 2005 | 2 | 4 | 7 | 2 | 6 | 18 | 6 | 8 | 6 | |||
| 2006 | 9 | 3 | 17 | 2 | 3 | 3 | 6 | 10 | 2 | 56 | 8 | |
| 2007 | 7 | 1 | 2 | 2 | 2 | 22 | 5 | 8 | 6 | 18 | ||
| 2008 | 6 | 16 | 77 | 6 | 5 | 3 | 2 | 3 | ||||
| 2009 | 11 | 95 | 55 | 0 | 0 | 3 | 0 | 0 | 0 | 0 | 0 | 17 |
| 2010 | 6 | 3 | 0 | 0 | 0 | 0 | 3 | 0 | 1 | 14 | 0 | 0 |
| 2011 | 0 | 0 | 3 | 3 | 0 | 0 | 0 | 0 | 0 | 1 | 0 | 0 |
| 2012 | 0 | 0 | 0 | 0 | 0 | 0 | 0 | 0 | 0 | 0 | 0 | 0 |
| 2013 | 0 | 0 | 0 | 0 | 0 | 0 | 0 | 0 | 0 | 0 | 0 | 0 |
| 2014 | 0 | 0 | 0 | 0 | 0 | 0 | 0 | 0 | 0 | 0 | 0 | 0 |
| 2015 | 0 | 0 | 0 | 0 | 0 | 0 | 0 | 10 | 19 | 4 | 10 | 19 |
| 2016 | 13 | 16 | 0 | 19 | 10 | 9 | 14 | 0 | 10 | 0 | 10 | 13 |
| 2017 | 10 | 26 | 10 | 20 | 16 | 10 | 23 | 20 | 19 | 10 | 39 | 12 |
| 2018 | 10 | 0 | 15 | 8 | 0 | 16 | 0 | 10 | 3 | 0 | 0 | 30 |
| 2019 | 0 | 0 | 0 | 3 | 0 | 0 | 3 | 0 | 0 | 6 | 0 | 12 |
| 2020 | 0 | 3 | 0 | 3 | 8 | 0 | 0 | 0 | 10 | 6 | 0 | 13 |
| 2021 | 0 | 0 | 10 | 10 | 10 | 3 | 11 | 6 | 10 | 0 | 9 | 10 |
| 2022 | 9 | 11 | 10 | 5 | 0 | 8 | 12 | 0 | 8 | 6 | 6 | 15 |
| 2023 | 9 | 5 | 13 | 9 | 7 | 7 | 7 | 8 | 7 | 14 | 7 | 20 |
| 2024 | 7 | |||||||||||
| - = No Data Reported; -- = Not Applicable; NA = Not Available; W = Withheld to avoid disclosure of individual company data. |
| Release Date: 3/29/2024 |
| Next Release Date: 4/30/2024 |
Referring Pages: