|
Download Data (XLS File) |
|
||||||||
|
||||||||
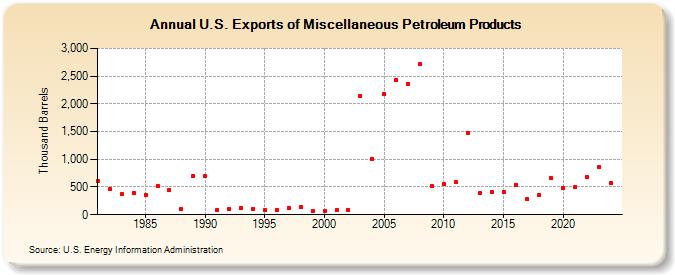
| U.S. Exports of Miscellaneous Petroleum Products (Thousand Barrels) | ||||||||
| Decade | Year-0 | Year-1 | Year-2 | Year-3 | Year-4 | Year-5 | Year-6 | Year-7 | Year-8 | Year-9 |
|---|---|---|---|---|---|---|---|---|---|---|
| 1980's | 610 | 456 | 375 | 383 | 359 | 521 | 447 | 98 | 700 | |
| 1990's | 699 | 85 | 102 | 118 | 107 | 85 | 84 | 125 | 134 | 73 |
| 2000's | 67 | 88 | 85 | 2,142 | 1,012 | 2,175 | 2,432 | 2,365 | 2,717 | 515 |
| 2010's | 546 | 586 | 1,474 | 396 | 417 | 417 | 542 | 279 | 356 | 660 |
| 2020's | 477 | 503 | 683 | 1,005 |
| - = No Data Reported; -- = Not Applicable; NA = Not Available; W = Withheld to avoid disclosure of individual company data. |
| Release Date: 3/29/2024 |
| Next Release Date: 8/30/2024 |