|
Download Data (XLS File) |
|
||||||||
|
||||||||
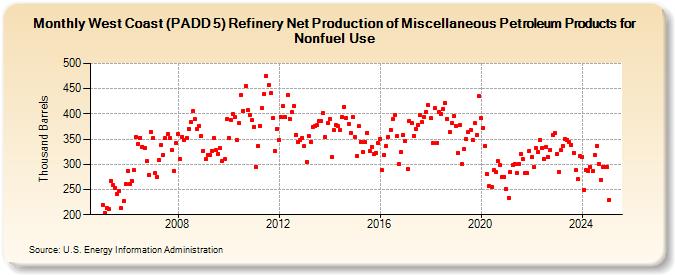
| West Coast (PADD 5) Refinery Net Production of Miscellaneous Petroleum Products for Nonfuel Use (Thousand Barrels) | ||||||||
| Year | Jan | Feb | Mar | Apr | May | Jun | Jul | Aug | Sep | Oct | Nov | Dec |
|---|---|---|---|---|---|---|---|---|---|---|---|---|
| 2005 | 220 | 203 | 213 | 212 | 267 | 259 | 253 | 242 | 248 | 213 | 227 | 260 |
| 2006 | 287 | 261 | 267 | 288 | 355 | 341 | 353 | 335 | 332 | 306 | 279 | 364 |
| 2007 | 352 | 282 | 275 | 308 | 338 | 318 | 352 | 360 | 352 | 328 | 287 | 343 |
| 2008 | 361 | 310 | 355 | 349 | 353 | 371 | 384 | 405 | 389 | 371 | 376 | 356 |
| 2009 | 327 | 310 | 319 | 319 | 327 | 352 | 328 | 321 | 332 | 307 | 310 | 389 |
| 2010 | 352 | 388 | 400 | 393 | 348 | 381 | 437 | 406 | 455 | 407 | 398 | 387 |
| 2011 | 374 | 295 | 337 | 376 | 411 | 439 | 476 | 457 | 441 | 392 | 326 | 371 |
| 2012 | 349 | 393 | 415 | 393 | 437 | 390 | 403 | 415 | 359 | 345 | 348 | 353 |
| 2013 | 336 | 305 | 357 | 345 | 374 | 375 | 377 | 385 | 385 | 401 | 354 | 381 |
| 2014 | 390 | 314 | 368 | 378 | 375 | 368 | 394 | 414 | 392 | 380 | 363 | 394 |
| 2015 | 355 | 317 | 375 | 344 | 324 | 344 | 363 | 326 | 335 | 321 | 323 | 342 |
| 2016 | 350 | 288 | 318 | 336 | 355 | 369 | 389 | 398 | 356 | 300 | 324 | 358 |
| 2017 | 346 | 290 | 386 | 382 | 357 | 371 | 377 | 397 | 383 | 393 | 404 | 417 |
| 2018 | 391 | 343 | 411 | 343 | 404 | 400 | 410 | 422 | 390 | 364 | 381 | 395 |
| 2019 | 376 | 323 | 378 | 301 | 330 | 350 | 364 | 368 | 349 | 381 | 359 | 435 |
| 2020 | 391 | 372 | 336 | 280 | 256 | 255 | 288 | 285 | 306 | 298 | 275 | 275 |
| 2021 | 251 | 234 | 285 | 298 | 301 | 282 | 301 | 321 | 310 | 283 | 282 | 327 |
| 2022 | 314 | 294 | 333 | 324 | 348 | 333 | 311 | 335 | 314 | 329 | 359 | 362 |
| 2023 | 321 | 285 | 328 | 337 | 350 | 349 | 344 | 339 | 323 | 288 | 270 | 316 |
| 2024 | 314 | |||||||||||
| - = No Data Reported; -- = Not Applicable; NA = Not Available; W = Withheld to avoid disclosure of individual company data. |
| Release Date: 3/29/2024 |
| Next Release Date: 4/30/2024 |