|
Download Data (XLS File) |
|
||||||||
|
||||||||
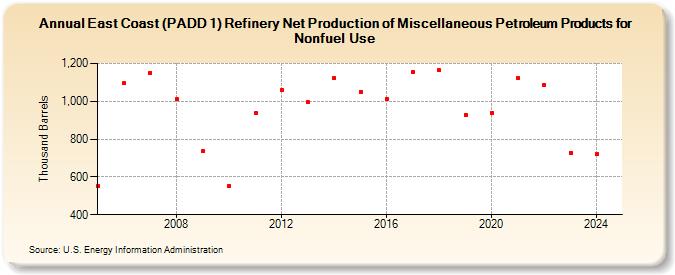
| East Coast (PADD 1) Refinery Net Production of Miscellaneous Petroleum Products for Nonfuel Use (Thousand Barrels) | ||||||||
| Decade | Year-0 | Year-1 | Year-2 | Year-3 | Year-4 | Year-5 | Year-6 | Year-7 | Year-8 | Year-9 |
|---|---|---|---|---|---|---|---|---|---|---|
| 2000's | 551 | 1,095 | 1,152 | 1,010 | 735 | |||||
| 2010's | 552 | 938 | 1,062 | 994 | 1,123 | 1,051 | 1,014 | 1,153 | 1,163 | 928 |
| 2020's | 940 | 1,124 | 1,088 | 800 |
| - = No Data Reported; -- = Not Applicable; NA = Not Available; W = Withheld to avoid disclosure of individual company data. |
| Release Date: 6/28/2024 |
| Next Release Date: 8/30/2024 |