|
Download Data (XLS File) |
|
||||||||
|
||||||||
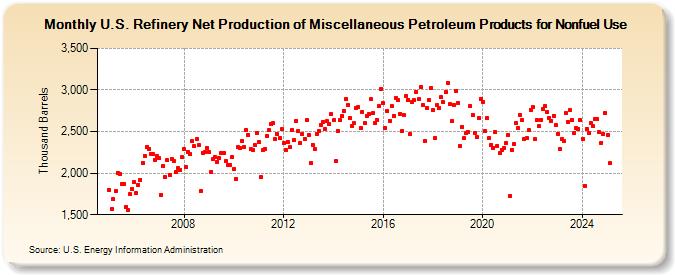
| U.S. Refinery Net Production of Miscellaneous Petroleum Products for Nonfuel Use (Thousand Barrels) | ||||||||
| Year | Jan | Feb | Mar | Apr | May | Jun | Jul | Aug | Sep | Oct | Nov | Dec |
|---|---|---|---|---|---|---|---|---|---|---|---|---|
| 2005 | 1,799 | 1,566 | 1,685 | 1,782 | 2,007 | 1,990 | 1,867 | 1,871 | 1,593 | 1,556 | 1,745 | 1,805 |
| 2006 | 1,893 | 1,756 | 1,863 | 1,921 | 2,125 | 2,210 | 2,312 | 2,291 | 2,235 | 2,226 | 2,159 | 2,202 |
| 2007 | 2,176 | 1,743 | 2,088 | 1,952 | 2,153 | 1,982 | 2,174 | 2,141 | 2,017 | 2,060 | 2,035 | 2,189 |
| 2008 | 2,285 | 2,073 | 2,257 | 2,228 | 2,382 | 2,321 | 2,406 | 2,335 | 1,785 | 2,247 | 2,252 | 2,303 |
| 2009 | 2,249 | 2,018 | 2,166 | 2,196 | 2,137 | 2,180 | 2,237 | 2,238 | 2,145 | 2,095 | 2,100 | 2,188 |
| 2010 | 2,047 | 1,935 | 2,310 | 2,301 | 2,392 | 2,316 | 2,518 | 2,459 | 2,293 | 2,283 | 2,338 | 2,480 |
| 2011 | 2,369 | 1,951 | 2,273 | 2,290 | 2,451 | 2,518 | 2,587 | 2,599 | 2,405 | 2,467 | 2,419 | 2,525 |
| 2012 | 2,366 | 2,283 | 2,374 | 2,310 | 2,522 | 2,396 | 2,630 | 2,504 | 2,362 | 2,470 | 2,409 | 2,635 |
| 2013 | 2,457 | 2,120 | 2,343 | 2,290 | 2,472 | 2,509 | 2,583 | 2,614 | 2,526 | 2,622 | 2,586 | 2,706 |
| 2014 | 2,634 | 2,141 | 2,512 | 2,636 | 2,688 | 2,751 | 2,889 | 2,814 | 2,658 | 2,570 | 2,599 | 2,788 |
| 2015 | 2,792 | 2,540 | 2,736 | 2,604 | 2,690 | 2,707 | 2,888 | 2,719 | 2,603 | 2,636 | 2,802 | 3,016 |
| 2016 | 2,843 | 2,543 | 2,749 | 2,632 | 2,809 | 2,690 | 2,905 | 2,876 | 2,715 | 2,508 | 2,695 | 2,930 |
| 2017 | 2,885 | 2,467 | 2,858 | 2,876 | 2,976 | 2,887 | 3,038 | 2,822 | 2,384 | 2,788 | 2,878 | 3,027 |
| 2018 | 2,763 | 2,425 | 2,816 | 2,786 | 2,911 | 2,852 | 2,973 | 3,084 | 2,827 | 2,628 | 2,823 | 2,991 |
| 2019 | 2,844 | 2,329 | 2,558 | 2,422 | 2,482 | 2,494 | 2,809 | 2,702 | 2,481 | 2,439 | 2,657 | 2,891 |
| 2020 | 2,857 | 2,505 | 2,661 | 2,417 | 2,336 | 2,307 | 2,492 | 2,327 | 2,239 | 2,281 | 2,301 | 2,360 |
| 2021 | 2,456 | 1,731 | 2,280 | 2,350 | 2,602 | 2,541 | 2,704 | 2,634 | 2,409 | 2,418 | 2,515 | 2,765 |
| 2022 | 2,790 | 2,406 | 2,643 | 2,562 | 2,638 | 2,770 | 2,810 | 2,735 | 2,668 | 2,632 | 2,690 | 2,578 |
| 2023 | 2,582 | 2,395 | 2,485 | 2,443 | 2,782 | 2,650 | 2,756 | 2,641 | 2,483 | 2,525 | 2,530 | 2,636 |
| 2024 | 2,408 | |||||||||||
| - = No Data Reported; -- = Not Applicable; NA = Not Available; W = Withheld to avoid disclosure of individual company data. |
| Release Date: 3/29/2024 |
| Next Release Date: 4/30/2024 |