|
Download Data (XLS File) |
|
||||||||
|
||||||||
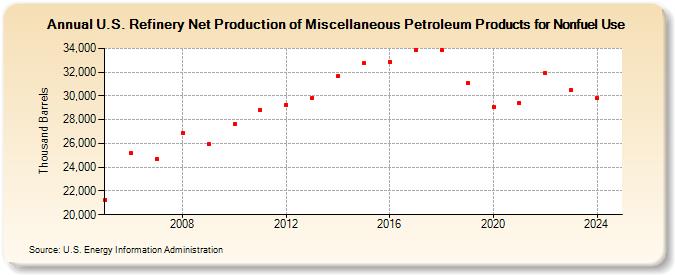
| U.S. Refinery Net Production of Miscellaneous Petroleum Products for Nonfuel Use (Thousand Barrels) | ||||||||
| Decade | Year-0 | Year-1 | Year-2 | Year-3 | Year-4 | Year-5 | Year-6 | Year-7 | Year-8 | Year-9 |
|---|---|---|---|---|---|---|---|---|---|---|
| 2000's | 21,266 | 25,193 | 24,710 | 26,874 | 25,949 | |||||
| 2010's | 27,672 | 28,854 | 29,261 | 29,828 | 31,680 | 32,733 | 32,895 | 33,886 | 33,879 | 31,108 |
| 2020's | 29,083 | 29,405 | 31,922 | 30,908 |
| - = No Data Reported; -- = Not Applicable; NA = Not Available; W = Withheld to avoid disclosure of individual company data. |
| Release Date: 3/29/2024 |
| Next Release Date: 8/30/2024 |