|
Download Data (XLS File) |
|
||||||||
|
||||||||
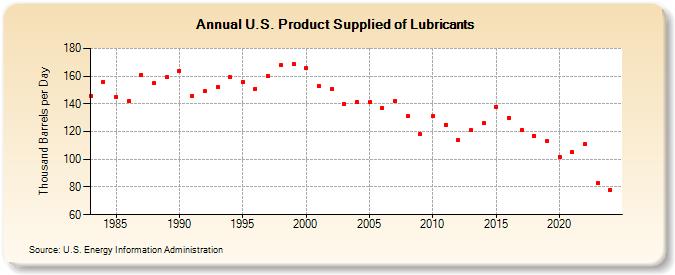
| U.S. Product Supplied of Lubricants (Thousand Barrels per Day) | ||||||||
| Decade | Year-0 | Year-1 | Year-2 | Year-3 | Year-4 | Year-5 | Year-6 | Year-7 | Year-8 | Year-9 |
|---|---|---|---|---|---|---|---|---|---|---|
| 1980's | 146 | 156 | 145 | 142 | 161 | 155 | 159 | |||
| 1990's | 164 | 146 | 149 | 152 | 159 | 156 | 151 | 160 | 168 | 169 |
| 2000's | 166 | 153 | 151 | 140 | 141 | 141 | 137 | 142 | 131 | 118 |
| 2010's | 131 | 125 | 114 | 121 | 126 | 138 | 130 | 121 | 117 | 113 |
| 2020's | 102 | 105 | 111 | 83 |
| - = No Data Reported; -- = Not Applicable; NA = Not Available; W = Withheld to avoid disclosure of individual company data. |
| Release Date: 3/29/2024 |
| Next Release Date: 8/30/2024 |