|
Download Data (XLS File) |
|
||||||||
|
||||||||
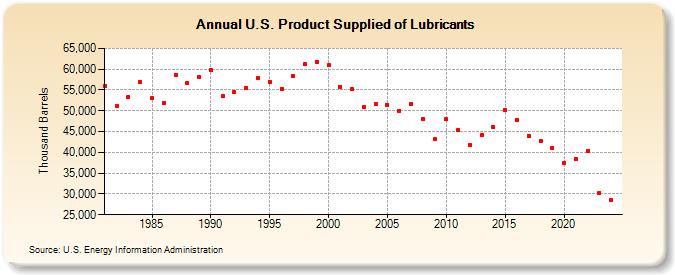
| U.S. Product Supplied of Lubricants (Thousand Barrels) | ||||||||
| Decade | Year-0 | Year-1 | Year-2 | Year-3 | Year-4 | Year-5 | Year-6 | Year-7 | Year-8 | Year-9 |
|---|---|---|---|---|---|---|---|---|---|---|
| 1980's | 55,958 | 51,029 | 53,426 | 56,972 | 53,096 | 51,916 | 58,694 | 56,601 | 58,055 | |
| 1990's | 59,743 | 53,447 | 54,491 | 55,486 | 57,994 | 56,998 | 55,316 | 58,435 | 61,173 | 61,813 |
| 2000's | 60,886 | 55,785 | 55,125 | 50,963 | 51,630 | 51,361 | 50,040 | 51,675 | 47,974 | 43,132 |
| 2010's | 47,923 | 45,469 | 41,834 | 44,262 | 46,170 | 50,280 | 47,733 | 44,003 | 42,700 | 41,161 |
| 2020's | 37,379 | 38,340 | 40,384 | 30,289 |
| - = No Data Reported; -- = Not Applicable; NA = Not Available; W = Withheld to avoid disclosure of individual company data. |
| Release Date: 6/28/2024 |
| Next Release Date: 8/30/2024 |