|
Download Data (XLS File) |
|
||||||||
|
||||||||
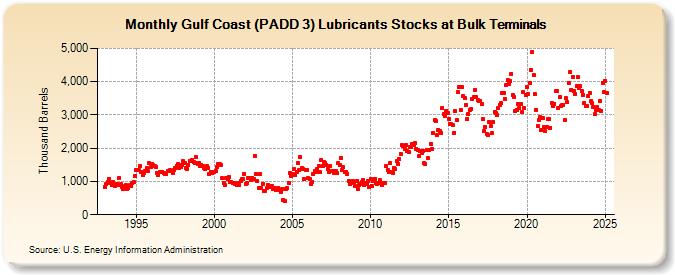
| Gulf Coast (PADD 3) Lubricants Stocks at Bulk Terminals (Thousand Barrels) | ||||||||
| Year | Jan | Feb | Mar | Apr | May | Jun | Jul | Aug | Sep | Oct | Nov | Dec |
|---|---|---|---|---|---|---|---|---|---|---|---|---|
| 1993 | 834 | 913 | 974 | 1,083 | 958 | 897 | 979 | 901 | 875 | 938 | 884 | 1,105 |
| 1994 | 918 | 845 | 782 | 863 | 891 | 787 | 813 | 882 | 865 | 946 | 986 | 1,175 |
| 1995 | 1,346 | 1,344 | 1,343 | 1,469 | 1,289 | 1,186 | 1,251 | 1,325 | 1,398 | 1,309 | 1,546 | 1,430 |
| 1996 | 1,520 | 1,494 | 1,462 | 1,432 | 1,239 | 1,186 | 1,291 | 1,290 | 1,291 | 1,252 | 1,234 | 1,238 |
| 1997 | 1,302 | 1,323 | 1,341 | 1,301 | 1,268 | 1,345 | 1,412 | 1,471 | 1,518 | 1,392 | 1,428 | 1,502 |
| 1998 | 1,607 | 1,543 | 1,392 | 1,381 | 1,509 | 1,621 | 1,603 | 1,631 | 1,572 | 1,565 | 1,721 | 1,536 |
| 1999 | 1,558 | 1,469 | 1,502 | 1,451 | 1,418 | 1,387 | 1,459 | 1,407 | 1,237 | 1,290 | 1,256 | 1,282 |
| 2000 | 1,299 | 1,317 | 1,432 | 1,523 | 1,512 | 1,493 | 1,090 | 966 | 896 | 1,109 | 1,065 | 1,123 |
| 2001 | 988 | 981 | 952 | 960 | 938 | 885 | 949 | 901 | 1,011 | 1,061 | 1,064 | 1,221 |
| 2002 | 932 | 946 | 1,092 | 1,110 | 1,051 | 1,110 | 1,083 | 1,769 | 1,225 | 1,005 | 818 | 1,229 |
| 2003 | 805 | 935 | 724 | 715 | 797 | 887 | 829 | 853 | 866 | 758 | 817 | 737 |
| 2004 | 778 | 797 | 737 | 685 | 782 | 444 | 423 | 773 | 789 | 957 | 1,248 | 1,149 |
| 2005 | 1,212 | 1,370 | 1,197 | 1,295 | 1,554 | 1,336 | 1,738 | 1,401 | 1,385 | 1,072 | 1,349 | 1,353 |
| 2006 | 1,103 | 1,060 | 930 | 989 | 1,209 | 1,309 | 1,294 | 1,374 | 1,458 | 1,274 | 1,650 | 1,454 |
| 2007 | 1,598 | 1,561 | 1,509 | 1,372 | 1,296 | 1,464 | 1,306 | 1,322 | 1,266 | 1,328 | 1,249 | 1,542 |
| 2008 | 1,508 | 1,703 | 1,336 | 1,420 | 1,275 | 1,291 | 1,232 | 1,014 | 925 | 964 | 1,013 | 986 |
| 2009 | 870 | 1,003 | 785 | 897 | 937 | 976 | 1,047 | 885 | 947 | 909 | 1,016 | 842 |
| 2010 | 1,079 | 870 | 1,018 | 1,086 | 945 | 922 | 955 | 1,031 | 951 | 905 | 941 | 941 |
| 2011 | 1,452 | 1,347 | 1,295 | 1,554 | 1,286 | 1,264 | 1,408 | 1,375 | 1,604 | 1,529 | 1,660 | 1,831 |
| 2012 | 2,086 | 2,067 | 1,973 | 2,097 | 1,905 | 1,876 | 2,035 | 2,028 | 2,120 | 2,096 | 2,150 | 1,973 |
| 2013 | 1,941 | 1,761 | 1,922 | 1,869 | 1,912 | 1,540 | 1,518 | 1,951 | 1,693 | 1,948 | 2,138 | 1,982 |
| 2014 | 2,457 | 2,836 | 2,809 | 2,395 | 2,547 | 2,530 | 2,466 | 3,216 | 3,034 | 2,973 | 3,131 | 3,069 |
| 2015 | 2,868 | 2,730 | 2,714 | 2,689 | 2,469 | 3,125 | 2,858 | 3,685 | 3,848 | 3,155 | 3,831 | 3,566 |
| 2016 | 3,507 | 3,309 | 2,869 | 3,031 | 3,159 | 3,167 | 3,493 | 3,534 | 3,760 | 3,528 | 3,438 | 3,424 |
| 2017 | 3,408 | 3,338 | 2,864 | 2,504 | 2,628 | 2,438 | 2,398 | 2,786 | 2,665 | 2,463 | 2,789 | 3,102 |
| 2018 | 3,044 | 2,989 | 3,208 | 3,303 | 3,345 | 3,656 | 3,671 | 3,482 | 3,902 | 4,037 | 3,926 | 4,022 |
| 2019 | 4,231 | 3,602 | 3,548 | 3,123 | 3,149 | 3,330 | 3,218 | 3,318 | 3,084 | 3,685 | 3,196 | 3,599 |
| 2020 | 3,846 | 3,626 | 3,972 | 4,358 | 4,894 | 4,196 | 3,618 | 3,159 | 2,672 | 2,838 | 2,940 | 2,541 |
| 2021 | 2,900 | 2,651 | 2,504 | 2,623 | 2,877 | 2,866 | 2,616 | 3,347 | 3,275 | 3,341 | 3,717 | 3,724 |
| 2022 | 3,199 | 3,552 | 3,261 | 3,305 | 3,308 | 2,855 | 3,499 | 3,378 | 3,971 | 4,283 | 3,753 | 4,144 |
| 2023 | 3,716 | 3,628 | 3,855 | 4,131 | 3,795 | 3,849 | 3,725 | 3,527 | 3,345 | 3,275 | 3,268 | 3,583 |
| 2024 | 3,673 | |||||||||||
| - = No Data Reported; -- = Not Applicable; NA = Not Available; W = Withheld to avoid disclosure of individual company data. |
| Release Date: 3/29/2024 |
| Next Release Date: 4/30/2024 |