|
Download Data (XLS File) |
|
||||||||
|
||||||||
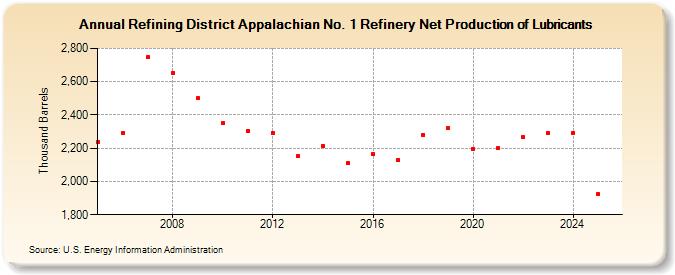
| Refining District Appalachian No. 1 Refinery Net Production of Lubricants (Thousand Barrels) | ||||||||
| Decade | Year-0 | Year-1 | Year-2 | Year-3 | Year-4 | Year-5 | Year-6 | Year-7 | Year-8 | Year-9 |
|---|---|---|---|---|---|---|---|---|---|---|
| 2000's | 2,238 | 2,292 | 2,747 | 2,654 | 2,499 | |||||
| 2010's | 2,351 | 2,302 | 2,293 | 2,151 | 2,214 | 2,110 | 2,165 | 2,131 | 2,281 | 2,319 |
| 2020's | 2,198 | 2,200 | 2,266 | 2,292 |
| - = No Data Reported; -- = Not Applicable; NA = Not Available; W = Withheld to avoid disclosure of individual company data. |
| Release Date: 3/29/2024 |
| Next Release Date: 8/30/2024 |