|
Download Data (XLS File) |
|
||||||||
|
||||||||
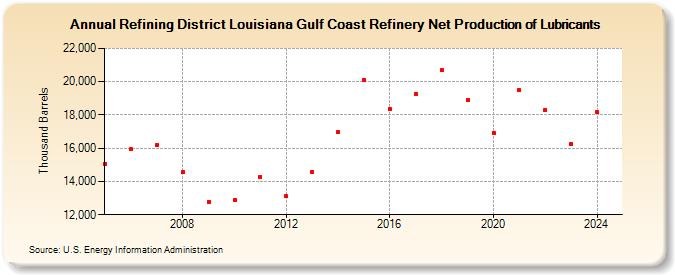
| Refining District Louisiana Gulf Coast Refinery Net Production of Lubricants (Thousand Barrels) | ||||||||
| Decade | Year-0 | Year-1 | Year-2 | Year-3 | Year-4 | Year-5 | Year-6 | Year-7 | Year-8 | Year-9 |
|---|---|---|---|---|---|---|---|---|---|---|
| 2000's | 15,077 | 15,935 | 16,203 | 14,543 | 12,783 | |||||
| 2010's | 12,883 | 14,291 | 13,105 | 14,568 | 16,956 | 20,100 | 18,345 | 19,267 | 20,694 | 18,905 |
| 2020's | 16,933 | 19,493 | 18,291 | 16,272 |
| - = No Data Reported; -- = Not Applicable; NA = Not Available; W = Withheld to avoid disclosure of individual company data. |
| Release Date: 6/28/2024 |
| Next Release Date: 8/30/2024 |