|
Download Data (XLS File) |
|
||||||||
|
||||||||
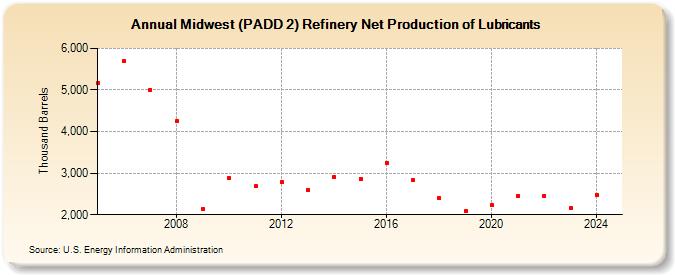
| Midwest (PADD 2) Refinery Net Production of Lubricants (Thousand Barrels) | ||||||||
| Decade | Year-0 | Year-1 | Year-2 | Year-3 | Year-4 | Year-5 | Year-6 | Year-7 | Year-8 | Year-9 |
|---|---|---|---|---|---|---|---|---|---|---|
| 2000's | 5,158 | 5,688 | 5,007 | 4,242 | 2,142 | |||||
| 2010's | 2,871 | 2,689 | 2,782 | 2,592 | 2,907 | 2,867 | 3,252 | 2,823 | 2,399 | 2,089 |
| 2020's | 2,230 | 2,456 | 2,454 | 2,151 |
| - = No Data Reported; -- = Not Applicable; NA = Not Available; W = Withheld to avoid disclosure of individual company data. |
| Release Date: 3/29/2024 |
| Next Release Date: 8/30/2024 |
Referring Pages: