|
Download Data (XLS File) |
|
||||||||
|
||||||||
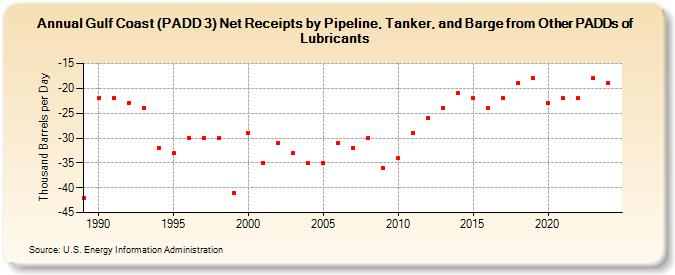
| Gulf Coast (PADD 3) Net Receipts by Pipeline, Tanker, and Barge from Other PADDs of Lubricants (Thousand Barrels per Day) | ||||||||
| Decade | Year-0 | Year-1 | Year-2 | Year-3 | Year-4 | Year-5 | Year-6 | Year-7 | Year-8 | Year-9 |
|---|---|---|---|---|---|---|---|---|---|---|
| 1980's | -42 | |||||||||
| 1990's | -22 | -22 | -23 | -24 | -32 | -33 | -30 | -30 | -30 | -41 |
| 2000's | -29 | -35 | -31 | -33 | -35 | -35 | -31 | -32 | -30 | -36 |
| 2010's | -34 | -29 | -26 | -24 | -21 | -22 | -24 | -22 | -19 | -18 |
| 2020's | -23 | -22 | -22 | -18 |
| - = No Data Reported; -- = Not Applicable; NA = Not Available; W = Withheld to avoid disclosure of individual company data. |
| Release Date: 3/29/2024 |
| Next Release Date: 8/30/2024 |