|
Download Data (XLS File) |
|
||||||||
|
||||||||
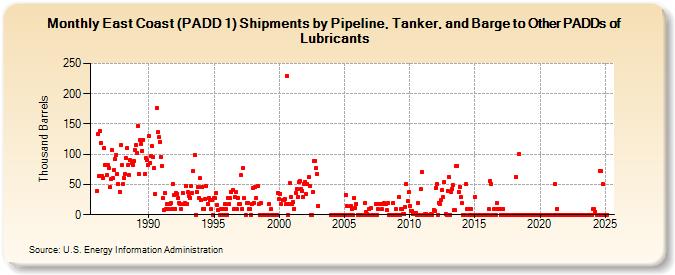
| East Coast (PADD 1) Shipments by Pipeline, Tanker, and Barge to Other PADDs of Lubricants (Thousand Barrels) | ||||||||
| Year | Jan | Feb | Mar | Apr | May | Jun | Jul | Aug | Sep | Oct | Nov | Dec |
|---|---|---|---|---|---|---|---|---|---|---|---|---|
| 1986 | 39 | 133 | 64 | 138 | 119 | 64 | 60 | 110 | 82 | 65 | 82 | 78 |
| 1987 | 46 | 59 | 107 | 60 | 74 | 92 | 99 | 68 | 51 | 38 | 115 | 82 |
| 1988 | 50 | 60 | 68 | 93 | 110 | 83 | 65 | 90 | 86 | 83 | 88 | 107 |
| 1989 | 115 | 102 | 147 | 67 | 123 | 117 | 106 | 124 | 67 | 93 | 90 | 83 |
| 1990 | 130 | 86 | 97 | 113 | 95 | 77 | 35 | 177 | 136 | 128 | 121 | 95 |
| 1991 | 81 | 28 | 8 | 36 | 9 | 17 | 10 | 18 | 19 | 9 | 51 | 32 |
| 1992 | 10 | 36 | 35 | 27 | 20 | 18 | 9 | 36 | 18 | 19 | 48 | 18 |
| 1993 | 37 | 31 | 28 | 47 | 36 | 72 | 99 | 0 | 38 | 46 | 28 | 60 |
| 1994 | 24 | 45 | 10 | 10 | 26 | 47 | 18 | 28 | 25 | 9 | 24 | 0 |
| 1995 | 27 | 27 | 36 | 16 | 8 | 0 | 9 | 0 | 9 | 0 | 18 | 9 |
| 1996 | 0 | 28 | 18 | 27 | 37 | 41 | 9 | 29 | 37 | 9 | 28 | 18 |
| 1997 | 18 | 65 | 10 | 77 | 27 | 0 | 19 | 20 | 9 | 9 | 0 | 18 |
| 1998 | 44 | 20 | 45 | 28 | 48 | 17 | 0 | 19 | 0 | 0 | 0 | 0 |
| 1999 | 0 | 0 | 0 | 18 | 9 | 0 | 0 | 0 | 0 | 0 | 0 | 36 |
| 2000 | 26 | 35 | 17 | 24 | 24 | 26 | 17 | 229 | 0 | 17 | 52 | 30 |
| 2001 | 17 | 21 | 10 | 36 | 43 | 29 | 54 | 56 | 43 | 40 | 30 | 50 |
| 2002 | 54 | 34 | 50 | 62 | 47 | 0 | 0 | 38 | 89 | 89 | 78 | 68 |
| 2003 | 15 | |||||||||||
| 2004 | 0 | 0 | 0 | 0 | 0 | 0 | 0 | 0 | 0 | 0 | 0 | 0 |
| 2005 | 0 | 33 | 14 | 0 | 0 | 0 | 14 | 9 | 0 | 28 | 11 | 18 |
| 2006 | 0 | 0 | 0 | 0 | 0 | 0 | 0 | 20 | 4 | 1 | 0 | 9 |
| 2007 | 11 | 0 | 0 | 0 | 0 | 18 | 0 | 9 | 18 | 18 | 18 | 9 |
| 2008 | 19 | 18 | 18 | 7 | 19 | 0 | 0 | 0 | 0 | 20 | 0 | 9 |
| 2009 | 0 | 0 | 29 | 0 | 9 | 9 | 1 | 1 | 13 | 51 | 22 | 37 |
| 2010 | 15 | 6 | 6 | 1 | 3 | 3 | 3 | 0 | 20 | 0 | 42 | 71 |
| 2011 | 0 | 0 | 1 | 1 | 0 | 0 | 0 | 0 | 1 | 0 | 8 | 6 |
| 2012 | 44 | 50 | 0 | 20 | 17 | 24 | 41 | 29 | 54 | 2 | 0 | 40 |
| 2013 | 63 | 0 | 37 | 43 | 49 | 7 | 7 | 80 | 81 | 38 | 46 | 29 |
| 2014 | 19 | 0 | 0 | 0 | 50 | 10 | 10 | 0 | 10 | 0 | 0 | 0 |
| 2015 | 30 | 0 | 0 | 0 | 0 | 0 | 0 | 0 | 0 | 0 | 0 | 0 |
| 2016 | 0 | 9 | 55 | 50 | 0 | 0 | 10 | 0 | 19 | 10 | 9 | 9 |
| 2017 | 0 | 0 | 10 | 0 | 0 | 0 | 0 | 0 | 0 | 0 | 0 | 0 |
| 2018 | 0 | 0 | 63 | 0 | 0 | 100 | 0 | 0 | 0 | 0 | 0 | 0 |
| 2019 | 0 | 0 | 0 | 0 | 0 | 0 | 0 | 0 | 0 | 0 | 0 | 0 |
| 2020 | 0 | 0 | 0 | 0 | 0 | 0 | 0 | 0 | 0 | 0 | 0 | 0 |
| 2021 | 0 | 0 | 50 | 0 | 10 | 0 | 0 | 0 | 0 | 0 | 0 | 0 |
| 2022 | 0 | 0 | 0 | 0 | 0 | 0 | 0 | 0 | 0 | 0 | 0 | 0 |
| 2023 | 0 | 0 | 0 | 0 | 0 | 0 | 0 | 0 | 0 | 0 | 0 | 0 |
| 2024 | 0 | |||||||||||
| - = No Data Reported; -- = Not Applicable; NA = Not Available; W = Withheld to avoid disclosure of individual company data. |
| Release Date: 3/29/2024 |
| Next Release Date: 4/30/2024 |