|
Download Data (XLS File) |
|
||||||||
|
||||||||
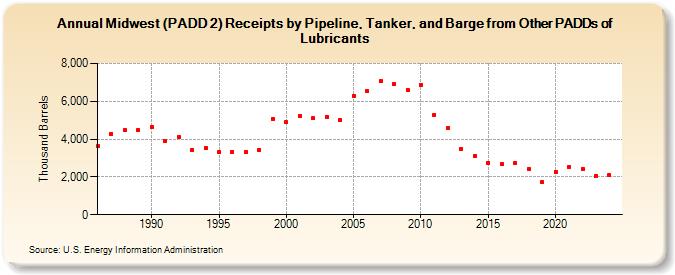
| Midwest (PADD 2) Receipts by Pipeline, Tanker, and Barge from Other PADDs of Lubricants (Thousand Barrels) | ||||||||
| Decade | Year-0 | Year-1 | Year-2 | Year-3 | Year-4 | Year-5 | Year-6 | Year-7 | Year-8 | Year-9 |
|---|---|---|---|---|---|---|---|---|---|---|
| 1980's | 3,615 | 4,287 | 4,461 | 4,479 | ||||||
| 1990's | 4,658 | 3,922 | 4,121 | 3,440 | 3,536 | 3,300 | 3,321 | 3,337 | 3,440 | 5,080 |
| 2000's | 4,903 | 5,224 | 5,091 | 5,190 | 5,023 | 6,293 | 6,540 | 7,079 | 6,927 | 6,603 |
| 2010's | 6,885 | 5,290 | 4,591 | 3,487 | 3,116 | 2,759 | 2,680 | 2,753 | 2,419 | 1,734 |
| 2020's | 2,251 | 2,538 | 2,444 | 2,056 |
| - = No Data Reported; -- = Not Applicable; NA = Not Available; W = Withheld to avoid disclosure of individual company data. |
| Release Date: 3/29/2024 |
| Next Release Date: 8/30/2024 |