|
Download Data (XLS File) |
|
||||||||
|
||||||||
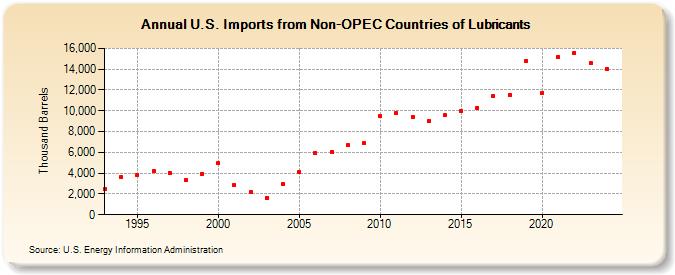
| U.S. Imports from Non-OPEC Countries of Lubricants (Thousand Barrels) | ||||||||
| Decade | Year-0 | Year-1 | Year-2 | Year-3 | Year-4 | Year-5 | Year-6 | Year-7 | Year-8 | Year-9 |
|---|---|---|---|---|---|---|---|---|---|---|
| 1990's | 2,496 | 3,618 | 3,784 | 4,185 | 4,026 | 3,327 | 3,958 | |||
| 2000's | 4,950 | 2,841 | 2,165 | 1,624 | 2,912 | 4,092 | 5,943 | 6,044 | 6,679 | 6,851 |
| 2010's | 9,483 | 9,793 | 9,400 | 9,026 | 9,549 | 10,008 | 10,268 | 11,404 | 11,551 | 14,805 |
| 2020's | 11,716 | 15,176 | 15,583 | 14,583 |
| - = No Data Reported; -- = Not Applicable; NA = Not Available; W = Withheld to avoid disclosure of individual company data. |
| Release Date: 3/29/2024 |
| Next Release Date: 8/30/2024 |