|
Download Data (XLS File) |
|
||||||||
|
||||||||
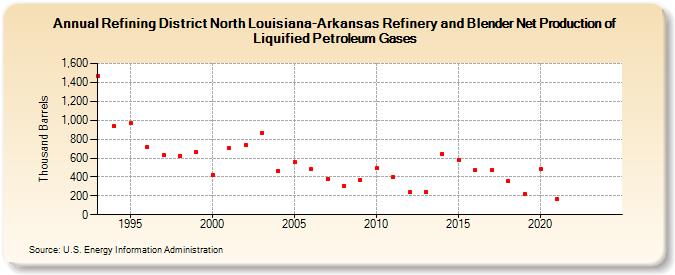
| Refining District North Louisiana-Arkansas Refinery and Blender Net Production of Liquified Petroleum Gases (Thousand Barrels) | ||||||||
| Decade | Year-0 | Year-1 | Year-2 | Year-3 | Year-4 | Year-5 | Year-6 | Year-7 | Year-8 | Year-9 |
|---|---|---|---|---|---|---|---|---|---|---|
| 1990's | 1,466 | 934 | 970 | 720 | 629 | 622 | 661 | |||
| 2000's | 423 | 702 | 735 | 867 | 465 | 556 | 483 | 381 | 307 | 369 |
| 2010's | 491 | 402 | 236 | 245 | 645 | 581 | 469 | 474 | 359 | 218 |
| 2020's | 485 | 162 | -- | -- |
| - = No Data Reported; -- = Not Applicable; NA = Not Available; W = Withheld to avoid disclosure of individual company data. |
| Release Date: 3/29/2024 |
| Next Release Date: 8/30/2024 |