|
Download Data (XLS File) |
|
||||||||
|
||||||||
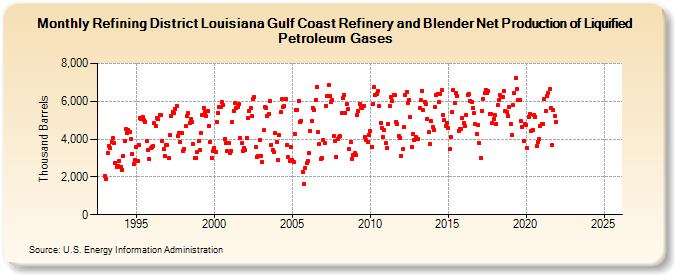
| Refining District Louisiana Gulf Coast Refinery and Blender Net Production of Liquified Petroleum Gases (Thousand Barrels) | ||||||||
| Year | Jan | Feb | Mar | Apr | May | Jun | Jul | Aug | Sep | Oct | Nov | Dec |
|---|---|---|---|---|---|---|---|---|---|---|---|---|
| 1993 | 2,051 | 1,881 | 3,255 | 3,651 | 3,506 | 3,829 | 4,044 | 3,772 | 2,744 | 2,545 | 2,582 | 2,838 |
| 1994 | 2,541 | 2,390 | 3,118 | 3,901 | 4,511 | 4,325 | 4,469 | 4,365 | 4,021 | 3,215 | 2,681 | 2,908 |
| 1995 | 3,561 | 2,867 | 3,680 | 5,114 | 5,061 | 5,171 | 5,005 | 4,911 | 3,878 | 3,449 | 2,966 | 3,507 |
| 1996 | 3,559 | 3,644 | 4,826 | 4,711 | 5,129 | 5,038 | 5,263 | 5,263 | 3,910 | 3,451 | 3,118 | 3,714 |
| 1997 | 3,677 | 2,984 | 4,203 | 5,247 | 5,437 | 5,388 | 5,569 | 5,762 | 4,174 | 4,345 | 3,838 | 4,314 |
| 1998 | 3,377 | 3,458 | 4,676 | 5,199 | 5,377 | 4,865 | 5,058 | 4,898 | 3,724 | 3,026 | 3,004 | 3,299 |
| 1999 | 3,904 | 3,448 | 4,313 | 5,287 | 5,664 | 5,447 | 5,225 | 5,494 | 4,690 | 3,853 | 3,021 | 3,350 |
| 2000 | 3,506 | 3,295 | 4,914 | 5,372 | 5,708 | 5,677 | 5,971 | 5,793 | 4,016 | 3,772 | 3,370 | 3,781 |
| 2001 | 3,245 | 3,384 | 4,923 | 5,493 | 5,903 | 5,662 | 5,690 | 5,835 | 4,059 | 3,782 | 3,386 | 3,522 |
| 2002 | 3,404 | 4,075 | 5,140 | 5,477 | 5,639 | 5,212 | 6,117 | 6,237 | 3,584 | 3,077 | 3,082 | 3,947 |
| 2003 | 3,111 | 2,803 | 4,459 | 5,689 | 5,665 | 5,205 | 5,350 | 6,011 | 3,706 | 3,425 | 3,310 | 4,299 |
| 2004 | 3,848 | 2,901 | 4,211 | 5,418 | 6,116 | 5,719 | 5,749 | 6,136 | 3,676 | 3,048 | 2,838 | 3,578 |
| 2005 | 2,912 | 2,796 | 4,287 | 5,552 | 5,529 | 6,028 | 4,905 | 4,974 | 2,260 | 1,629 | 2,481 | 2,712 |
| 2006 | 2,838 | 3,271 | 4,436 | 4,949 | 5,651 | 5,529 | 6,070 | 6,749 | 4,362 | 3,764 | 2,956 | 3,007 |
| 2007 | 3,968 | 3,773 | 5,775 | 6,259 | 6,853 | 6,262 | 5,948 | 6,052 | 4,177 | 3,901 | 3,067 | 4,021 |
| 2008 | 4,126 | 4,138 | 5,393 | 6,157 | 6,334 | 5,383 | 5,869 | 5,566 | 3,474 | 3,846 | 2,972 | 3,135 |
| 2009 | 3,245 | 3,140 | 5,296 | 5,465 | 5,879 | 5,687 | 5,647 | 5,769 | 4,120 | 3,934 | 3,831 | 4,240 |
| 2010 | 4,402 | 3,584 | 5,853 | 6,741 | 6,336 | 6,402 | 6,528 | 5,757 | 4,872 | 4,580 | 4,122 | 4,481 |
| 2011 | 3,792 | 3,547 | 4,817 | 5,745 | 6,232 | 5,993 | 6,330 | 6,322 | 4,893 | 4,792 | 4,186 | 4,063 |
| 2012 | 3,110 | 3,456 | 4,618 | 6,332 | 6,470 | 5,911 | 6,053 | 5,166 | 3,608 | 4,262 | 3,928 | 4,087 |
| 2013 | 4,028 | 4,000 | 5,639 | 6,042 | 6,560 | 5,525 | 5,960 | 5,851 | 5,082 | 4,350 | 3,733 | 4,943 |
| 2014 | 4,650 | 4,458 | 5,680 | 6,327 | 6,399 | 5,963 | 6,389 | 6,584 | 5,276 | 4,996 | 4,704 | 4,845 |
| 2015 | 4,606 | 3,457 | 4,124 | 5,417 | 6,584 | 5,907 | 6,421 | 6,296 | 4,447 | 4,536 | 4,546 | 5,122 |
| 2016 | 4,826 | 4,719 | 5,292 | 6,359 | 6,409 | 6,033 | 5,964 | 5,653 | 5,359 | 4,777 | 4,247 | 4,761 |
| 2017 | 3,784 | 3,021 | 5,500 | 6,123 | 6,424 | 6,604 | 6,456 | 6,528 | 5,339 | 5,323 | 4,876 | 5,051 |
| 2018 | 5,255 | 4,817 | 5,795 | 6,065 | 6,308 | 6,222 | 6,247 | 6,542 | 5,501 | 5,444 | 5,231 | 5,687 |
| 2019 | 4,819 | 4,208 | 5,803 | 6,431 | 7,243 | 6,652 | 6,047 | 6,064 | 4,938 | 4,639 | 3,914 | 4,791 |
| 2020 | 4,760 | 3,538 | 5,170 | 5,336 | 4,452 | 4,484 | 5,285 | 5,185 | 3,614 | 3,837 | 3,985 | 4,691 |
| 2021 | 4,789 | 4,794 | 6,127 | 5,470 | 6,286 | 6,420 | 6,649 | 5,634 | 3,670 | 5,525 | 5,242 | 4,930 |
| 2022 | -- | -- | -- | -- | -- | -- | -- | -- | -- | -- | -- | -- |
| 2023 | -- | -- | -- | -- | -- | -- | -- | -- | -- | -- | -- | -- |
| 2024 | -- | |||||||||||
| - = No Data Reported; -- = Not Applicable; NA = Not Available; W = Withheld to avoid disclosure of individual company data. |
| Release Date: 3/29/2024 |
| Next Release Date: 4/30/2024 |