|
Download Data (XLS File) |
|
||||||||
|
||||||||
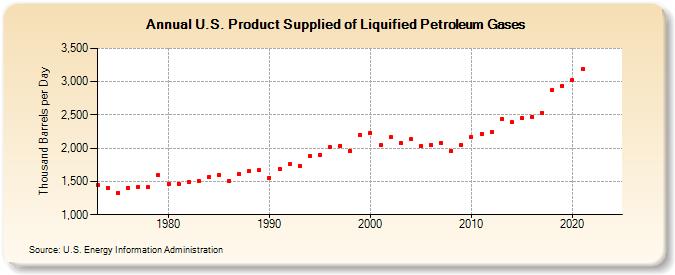
| U.S. Product Supplied of Liquified Petroleum Gases (Thousand Barrels per Day) | ||||||||
| Decade | Year-0 | Year-1 | Year-2 | Year-3 | Year-4 | Year-5 | Year-6 | Year-7 | Year-8 | Year-9 |
|---|---|---|---|---|---|---|---|---|---|---|
| 1970's | 1,449 | 1,406 | 1,333 | 1,404 | 1,422 | 1,413 | 1,592 | |||
| 1980's | 1,469 | 1,466 | 1,499 | 1,509 | 1,572 | 1,599 | 1,512 | 1,612 | 1,656 | 1,668 |
| 1990's | 1,556 | 1,689 | 1,755 | 1,734 | 1,880 | 1,899 | 2,012 | 2,038 | 1,952 | 2,195 |
| 2000's | 2,231 | 2,044 | 2,163 | 2,074 | 2,132 | 2,030 | 2,052 | 2,085 | 1,954 | 2,051 |
| 2010's | 2,170 | 2,218 | 2,243 | 2,445 | 2,390 | 2,455 | 2,474 | 2,535 | 2,881 | 2,941 |
| 2020's | 3,019 | 3,183 | -- | -- |
| - = No Data Reported; -- = Not Applicable; NA = Not Available; W = Withheld to avoid disclosure of individual company data. |
| Release Date: 6/28/2024 |
| Next Release Date: 8/30/2024 |