|
Download Data (XLS File) |
|
||||||||
|
||||||||
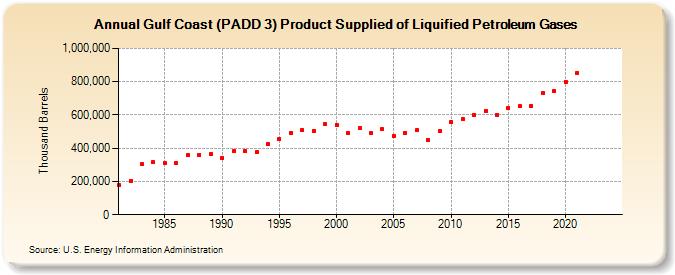
| Gulf Coast (PADD 3) Product Supplied of Liquified Petroleum Gases (Thousand Barrels) | ||||||||
| Decade | Year-0 | Year-1 | Year-2 | Year-3 | Year-4 | Year-5 | Year-6 | Year-7 | Year-8 | Year-9 |
|---|---|---|---|---|---|---|---|---|---|---|
| 1980's | 176,313 | 202,706 | 302,006 | 314,232 | 308,791 | 309,171 | 358,471 | 361,900 | 363,265 | |
| 1990's | 342,631 | 384,003 | 385,222 | 375,484 | 423,804 | 454,850 | 493,153 | 509,449 | 504,966 | 542,720 |
| 2000's | 540,902 | 492,059 | 518,587 | 490,087 | 513,372 | 474,487 | 493,796 | 506,799 | 448,376 | 500,539 |
| 2010's | 557,951 | 573,916 | 600,521 | 625,412 | 601,052 | 640,557 | 653,395 | 654,041 | 731,183 | 743,871 |
| 2020's | 800,614 | 854,441 | -- | -- |
| - = No Data Reported; -- = Not Applicable; NA = Not Available; W = Withheld to avoid disclosure of individual company data. |
| Release Date: 6/28/2024 |
| Next Release Date: 8/30/2024 |