|
Download Data (XLS File) |
|
||||||||
|
||||||||
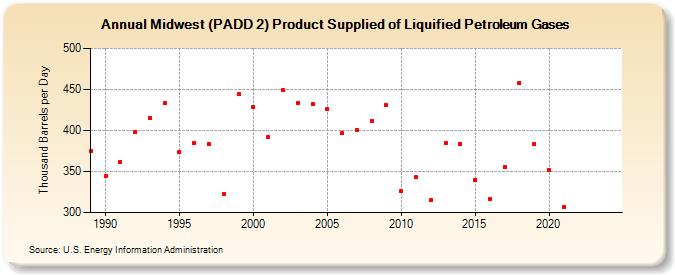
| Midwest (PADD 2) Product Supplied of Liquified Petroleum Gases (Thousand Barrels per Day) | ||||||||
| Decade | Year-0 | Year-1 | Year-2 | Year-3 | Year-4 | Year-5 | Year-6 | Year-7 | Year-8 | Year-9 |
|---|---|---|---|---|---|---|---|---|---|---|
| 1980's | 375 | |||||||||
| 1990's | 344 | 362 | 398 | 415 | 433 | 374 | 385 | 383 | 323 | 444 |
| 2000's | 428 | 392 | 449 | 433 | 432 | 426 | 397 | 400 | 412 | 431 |
| 2010's | 326 | 343 | 315 | 385 | 383 | 340 | 316 | 356 | 458 | 384 |
| 2020's | 352 | 307 | -- | -- |
| - = No Data Reported; -- = Not Applicable; NA = Not Available; W = Withheld to avoid disclosure of individual company data. |
| Release Date: 3/29/2024 |
| Next Release Date: 8/30/2024 |