|
Download Data (XLS File) |
|
||||||||
|
||||||||
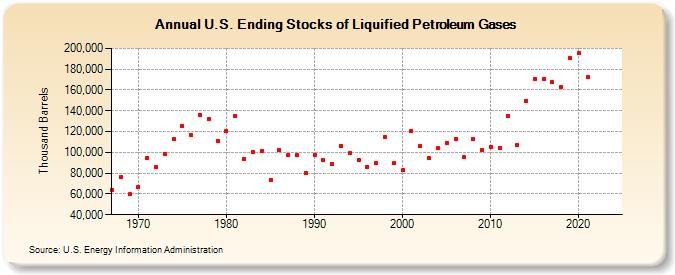
| U.S. Ending Stocks of Liquified Petroleum Gases (Thousand Barrels) | ||||||||
| Decade | Year-0 | Year-1 | Year-2 | Year-3 | Year-4 | Year-5 | Year-6 | Year-7 | Year-8 | Year-9 |
|---|---|---|---|---|---|---|---|---|---|---|
| 1960's | 64,165 | 76,069 | 59,602 | |||||||
| 1970's | 67,043 | 94,713 | 85,717 | 98,641 | 112,542 | 125,148 | 116,295 | 136,342 | 132,009 | 110,699 |
| 1980's | 120,455 | 134,651 | 93,975 | 100,570 | 100,849 | 73,530 | 102,658 | 97,094 | 97,339 | 80,230 |
| 1990's | 97,908 | 92,340 | 88,721 | 106,484 | 99,454 | 93,073 | 86,213 | 89,481 | 115,082 | 89,339 |
| 2000's | 82,544 | 120,900 | 105,708 | 94,473 | 103,800 | 109,362 | 113,092 | 95,592 | 113,134 | 102,147 |
| 2010's | 105,124 | 103,727 | 135,355 | 106,813 | 149,494 | 170,996 | 170,464 | 167,322 | 162,951 | 190,796 |
| 2020's | 195,527 | 172,358 | -- | -- |
| - = No Data Reported; -- = Not Applicable; NA = Not Available; W = Withheld to avoid disclosure of individual company data. |
| Release Date: 3/29/2024 |
| Next Release Date: 8/30/2024 |