|
Download Data (XLS File) |
|
||||||||
|
||||||||
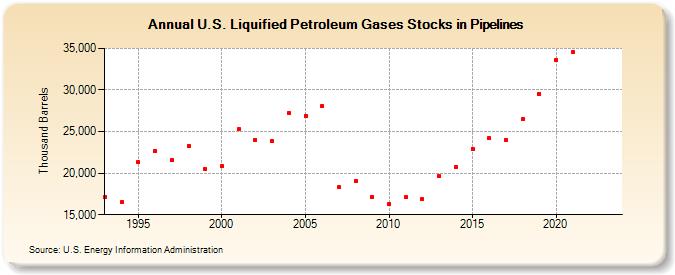
| U.S. Liquified Petroleum Gases Stocks in Pipelines (Thousand Barrels) | ||||||||
| Decade | Year-0 | Year-1 | Year-2 | Year-3 | Year-4 | Year-5 | Year-6 | Year-7 | Year-8 | Year-9 |
|---|---|---|---|---|---|---|---|---|---|---|
| 1990's | 17,116 | 16,506 | 21,289 | 22,687 | 21,556 | 23,278 | 20,485 | |||
| 2000's | 20,849 | 25,256 | 24,026 | 23,860 | 27,258 | 26,904 | 28,084 | 18,297 | 19,063 | 17,138 |
| 2010's | 16,317 | 17,097 | 16,833 | 19,648 | 20,723 | 22,952 | 24,184 | 24,041 | 26,463 | 29,538 |
| 2020's | 33,568 | 34,524 | -- | -- |
| - = No Data Reported; -- = Not Applicable; NA = Not Available; W = Withheld to avoid disclosure of individual company data. |
| Release Date: 3/29/2024 |
| Next Release Date: 8/30/2024 |