|
Download Data (XLS File) |
|
||||||||
|
||||||||
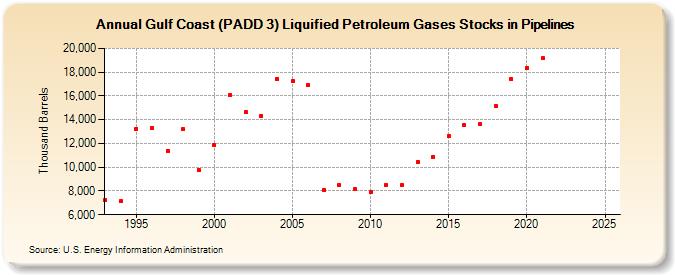
| Gulf Coast (PADD 3) Liquified Petroleum Gases Stocks in Pipelines (Thousand Barrels) | ||||||||
| Decade | Year-0 | Year-1 | Year-2 | Year-3 | Year-4 | Year-5 | Year-6 | Year-7 | Year-8 | Year-9 |
|---|---|---|---|---|---|---|---|---|---|---|
| 1990's | 7,237 | 7,133 | 13,239 | 13,283 | 11,365 | 13,191 | 9,756 | |||
| 2000's | 11,875 | 16,076 | 14,634 | 14,307 | 17,412 | 17,228 | 16,917 | 8,086 | 8,463 | 8,142 |
| 2010's | 7,874 | 8,482 | 8,460 | 10,444 | 10,874 | 12,659 | 13,541 | 13,594 | 15,151 | 17,408 |
| 2020's | 18,341 | 19,158 | -- | -- |
| - = No Data Reported; -- = Not Applicable; NA = Not Available; W = Withheld to avoid disclosure of individual company data. |
| Release Date: 6/28/2024 |
| Next Release Date: 8/30/2024 |