|
Download Data (XLS File) |
|
||||||||
|
||||||||
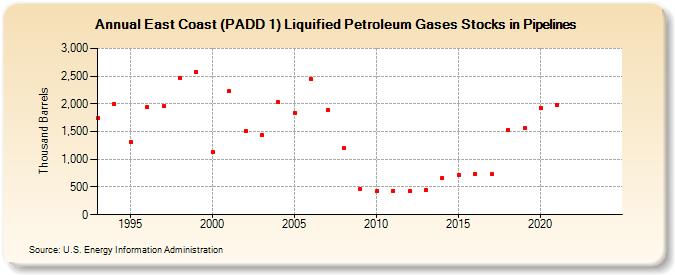
| East Coast (PADD 1) Liquified Petroleum Gases Stocks in Pipelines (Thousand Barrels) | ||||||||
| Decade | Year-0 | Year-1 | Year-2 | Year-3 | Year-4 | Year-5 | Year-6 | Year-7 | Year-8 | Year-9 |
|---|---|---|---|---|---|---|---|---|---|---|
| 1990's | 1,741 | 1,999 | 1,311 | 1,941 | 1,955 | 2,474 | 2,583 | |||
| 2000's | 1,128 | 2,231 | 1,509 | 1,446 | 2,030 | 1,843 | 2,441 | 1,886 | 1,195 | 463 |
| 2010's | 422 | 435 | 423 | 440 | 666 | 724 | 732 | 727 | 1,532 | 1,563 |
| 2020's | 1,931 | 1,974 | -- | -- |
| - = No Data Reported; -- = Not Applicable; NA = Not Available; W = Withheld to avoid disclosure of individual company data. |
| Release Date: 3/29/2024 |
| Next Release Date: 8/30/2024 |