|
Download Data (XLS File) |
|
||||||||
|
||||||||
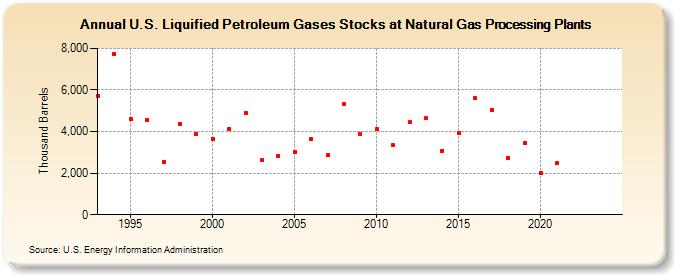
| U.S. Liquified Petroleum Gases Stocks at Natural Gas Processing Plants (Thousand Barrels) | ||||||||
| Decade | Year-0 | Year-1 | Year-2 | Year-3 | Year-4 | Year-5 | Year-6 | Year-7 | Year-8 | Year-9 |
|---|---|---|---|---|---|---|---|---|---|---|
| 1990's | 5,717 | 7,731 | 4,595 | 4,576 | 2,548 | 4,385 | 3,890 | |||
| 2000's | 3,655 | 4,127 | 4,902 | 2,642 | 2,805 | 3,010 | 3,624 | 2,860 | 5,307 | 3,874 |
| 2010's | 4,119 | 3,340 | 4,445 | 4,632 | 3,081 | 3,922 | 5,591 | 5,047 | 2,737 | 3,463 |
| 2020's | 1,994 | 2,481 | -- | -- |
| - = No Data Reported; -- = Not Applicable; NA = Not Available; W = Withheld to avoid disclosure of individual company data. |
| Release Date: 8/30/2024 |
| Next Release Date: 8/29/2025 |