|
Download Data (XLS File) |
|
||||||||
|
||||||||
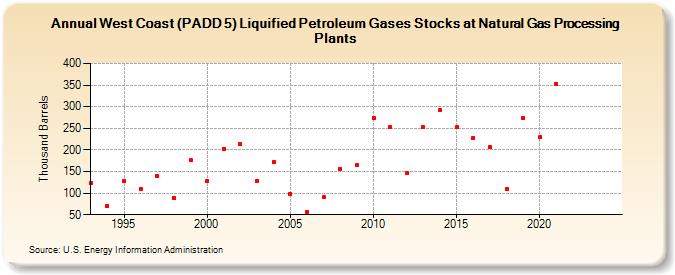
| West Coast (PADD 5) Liquified Petroleum Gases Stocks at Natural Gas Processing Plants (Thousand Barrels) | ||||||||
| Decade | Year-0 | Year-1 | Year-2 | Year-3 | Year-4 | Year-5 | Year-6 | Year-7 | Year-8 | Year-9 |
|---|---|---|---|---|---|---|---|---|---|---|
| 1990's | 124 | 71 | 127 | 109 | 139 | 89 | 176 | |||
| 2000's | 127 | 203 | 213 | 129 | 172 | 99 | 57 | 90 | 155 | 165 |
| 2010's | 274 | 252 | 146 | 252 | 292 | 252 | 228 | 206 | 110 | 273 |
| 2020's | 229 | 353 | -- | -- |
| - = No Data Reported; -- = Not Applicable; NA = Not Available; W = Withheld to avoid disclosure of individual company data. |
| Release Date: 3/29/2024 |
| Next Release Date: 8/30/2024 |