|
Download Data (XLS File) |
|
||||||||
|
||||||||
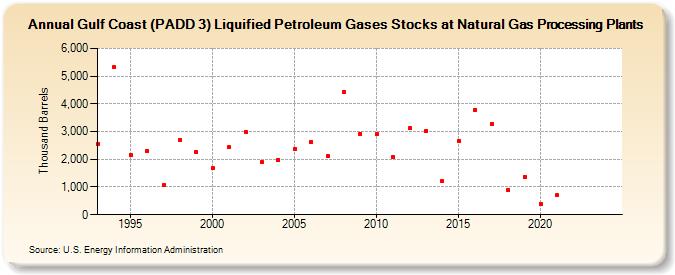
| Gulf Coast (PADD 3) Liquified Petroleum Gases Stocks at Natural Gas Processing Plants (Thousand Barrels) | ||||||||
| Decade | Year-0 | Year-1 | Year-2 | Year-3 | Year-4 | Year-5 | Year-6 | Year-7 | Year-8 | Year-9 |
|---|---|---|---|---|---|---|---|---|---|---|
| 1990's | 2,567 | 5,318 | 2,151 | 2,300 | 1,074 | 2,708 | 2,268 | |||
| 2000's | 1,672 | 2,431 | 2,976 | 1,901 | 1,987 | 2,353 | 2,624 | 2,106 | 4,443 | 2,926 |
| 2010's | 2,898 | 2,074 | 3,119 | 3,023 | 1,205 | 2,670 | 3,788 | 3,278 | 885 | 1,371 |
| 2020's | 396 | 700 | -- | -- |
| - = No Data Reported; -- = Not Applicable; NA = Not Available; W = Withheld to avoid disclosure of individual company data. |
| Release Date: 3/29/2024 |
| Next Release Date: 8/30/2024 |